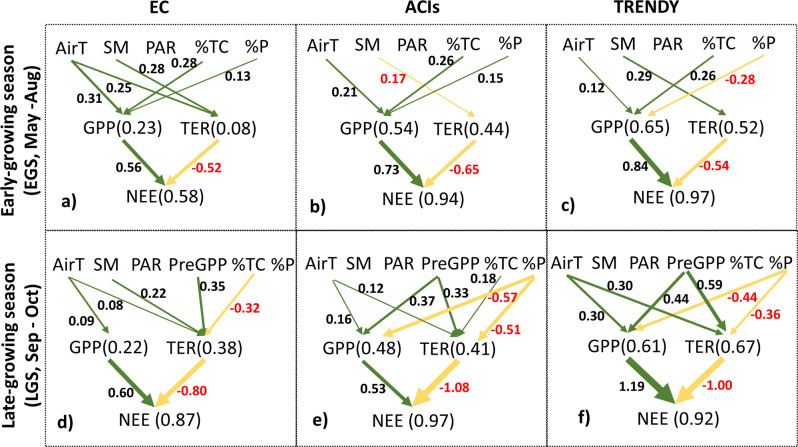
Fig. 5. Climate and environmental controls on net CO2 uptake vary among seasons, and DGVMs need to better capture the respiration processes during the late-growing season.
Structural equation models (SEMs) of the relative influence of component fluxes (i.e., gross primary productivity (GPP) and total ecosystem respiration (TER)) on net CO2 uptake (i.e., net ecosystem exchange: NEE) and climatic and environmental controls including air temperature (AirT), soil moisture (SM), photosynthetically active radiation (PAR), preseason GPP (PreGPP), percent tree cover (%TC), and percent of permafrost extent (%P) on CO2 fluxes in the NHL. Only significant paths are shown (p < 0.05) with the standardized regression coefficient, and thicker (thinner) lines indicating stronger (weaker) relationships. Numbers in brackets after CO2 fluxes (i.e., GPP, TER, NEE) indicate the total endogenous (dependent) variation explained by all exogenous (independent) variables in the regression model. Positive (green arrows) and negative (yellow arrows) coefficients indicate respective positive and negative relationships. In the figures, a, b, c are EC, ACI, and TRENDY results, respectively, for the early growing season CO2 cycle; whereas d, e, f are EC, ACI, and TRENDY results, respectively, for the late growing season CO2 cycle.

