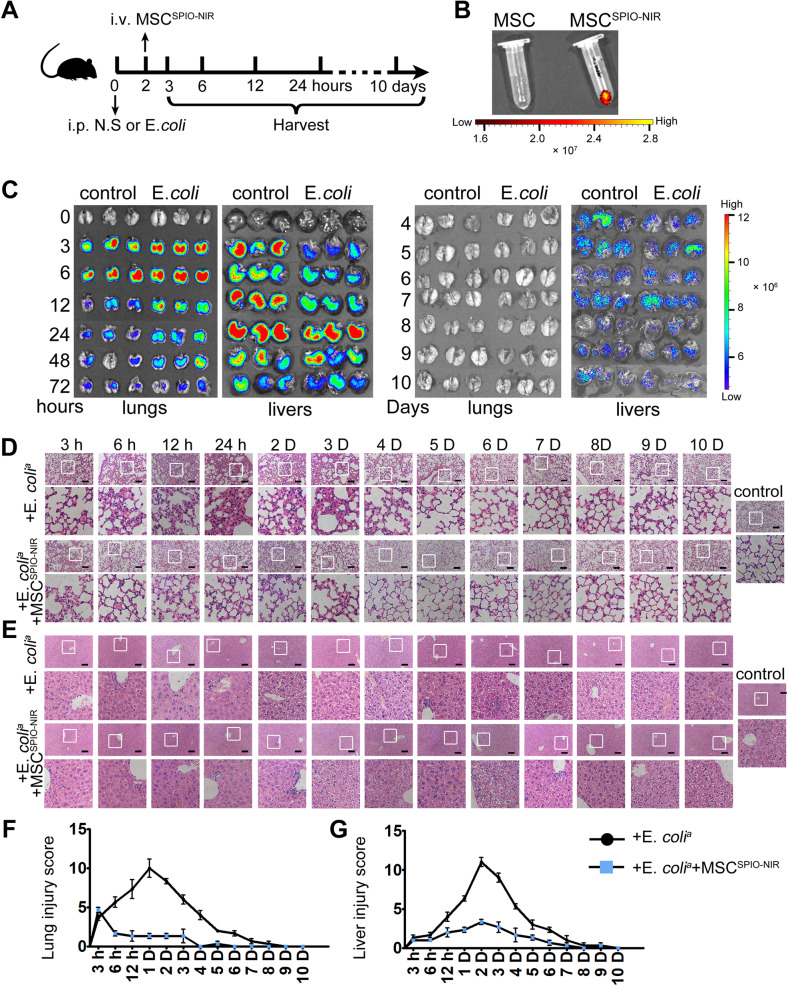
Fig. 2. The spatiotemporal distribution and therapeutic effect of MSCSPIO-NIR.
A Schematic of the MSCSPIO-NIR tracing experiment setup (n = 3). B, C The ex vivo imaging of B EP tubes, C lungs, and livers were carried out on the In Vivo Imaging System. Representative H&E staining of D lung sections or E liver sections. Scale bars, 100 μm. Histological injury of F lungs and G livers were scored as described in Materials and Methods. Data are shown as mean ± SEM (n = 3).

