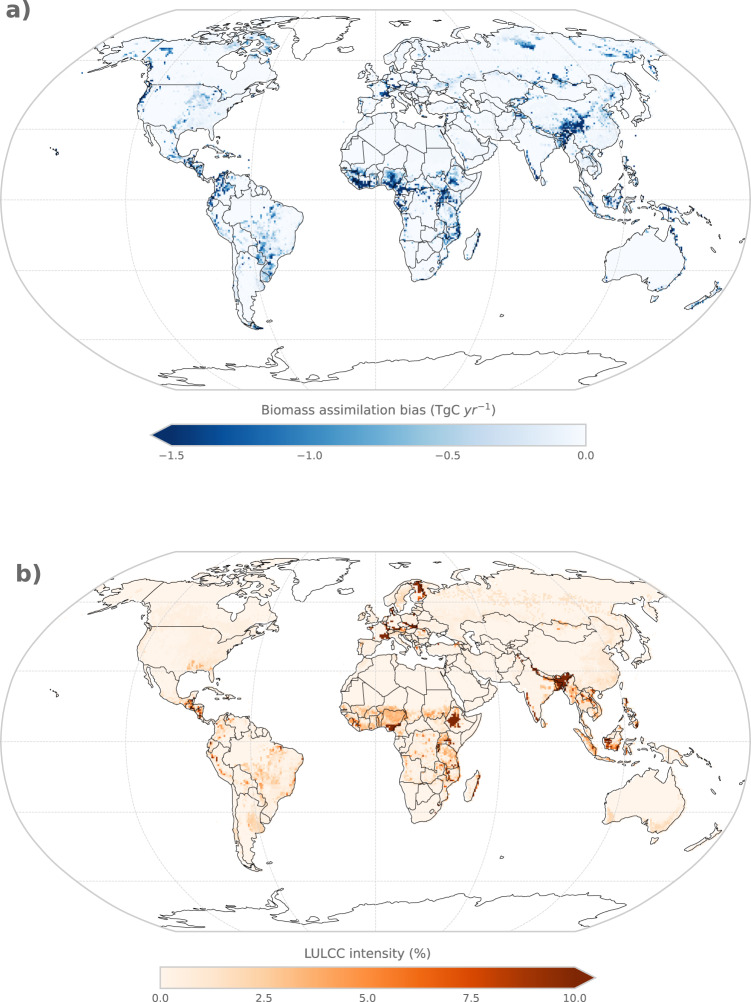
Fig. 3. Global maps of biomass assimilation bias and LULCC intensity according to LUH2.
The biomass assimilation bias (a) is due to uncertainties in the LULCC forcing and plant functional type distribution in BLUE and is calculated as the average (2000–2019) difference in woody biomass carbon stocks between the assimilated time series in BLUE and the observed time series by ref. 16. The LULCC intensity (b) is defined as the average (2000–2019) area percentage per grid cell, that is cleared or harvested. Note the regions where high biomass assimilation biases coincide with strong LULCC intensities in Northeast India, Europe, and Equatorial Africa.

