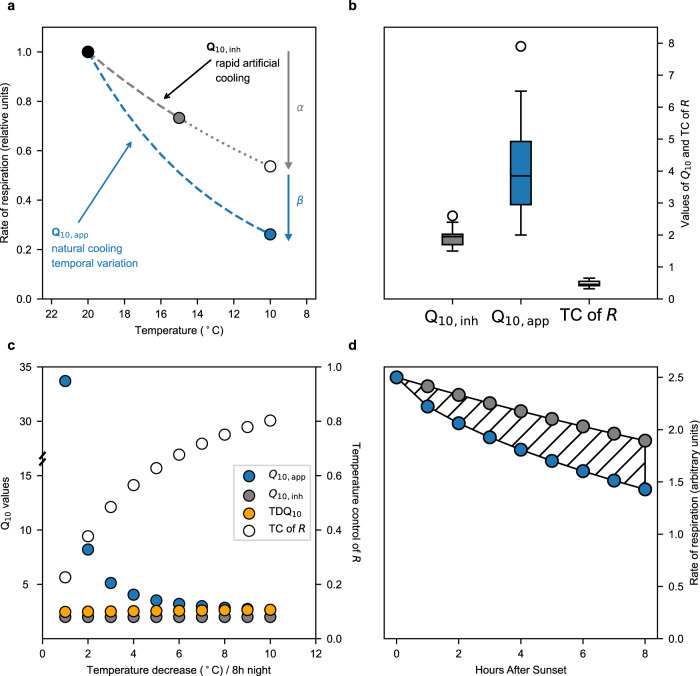
Fig. 2. Concepts explained.
a Conceptual figure of how RT (rate of respiration at varying temperature) is measured in response to either (i) common short-term rapid artificial cooling (e.g. during 10–30 min) of leaf/plant can be used to calculate Q10,inh (inherent temperature sensitivity of R, Equation 1, using point connected by the grey dashed line), or (ii) natural cooling (over several hours) of the environment along temporal variation in T can be used to calculate Q10,app (apparent temperature sensitivity of R, Equation 1, using the points connected by the blue dashed line). The decrease in RT due to change in T alone is denoted α and the further observed decrease in R is denoted β. Common practise is also to extrapolate (represented by a short-dashed curve) how RT is assumed to change (open symbol) with T-change further into the night than the actual measured T-change (long dashed curve). b Box-and-whisker plots (The centre line is the median. The lower whisker is the lowest datum above the first quartile − 1.5 × interquartile range. The upper whisker is the highest datum below the first quartile − 1.5 × interquartile range. Any points outside the whiskers are plotted separately) of Q10,app, Q10,inh, and TC (temperature control) of R (α/(α + β)) across ten species (46 replicate plants, Supplementary Table 2). c Dependence of Q10 and TC of R on the rate of nocturnal cooling. In the example shown, it was assumed Q10,inh = 2.0. Q10,app and TC were calculated as described in Fig. 2a assuming that R,To/R,To-initial = 1–0.08 × h0.54 (Fig. 1a). TDQ10 = 3.09 − 0.0435 × T (temperature-dependent Q10, ref. 22, Equation 2). d Modelled nocturnal variations in R in response to T decrease during the night, including and excluding effects of non-temperature control on metabolism. RT = RTo × Q10,inh [(T-To)/10], where RTo-initial = 2.5 and Q10,inh = 2. Grey symbols represent constant RTo and a T decrease of 0.5 °C/h. Blue symbols represent RTo/RTo-initial = 1 – 0.08 × h0.54 (Fig. 1a) and a temperature decrease of 0.5 °C/h. Dashed area is the cumulated difference in nocturnal R with time throughout the night without and with non-temperature control. Data are available in Supplementary Data 4.

