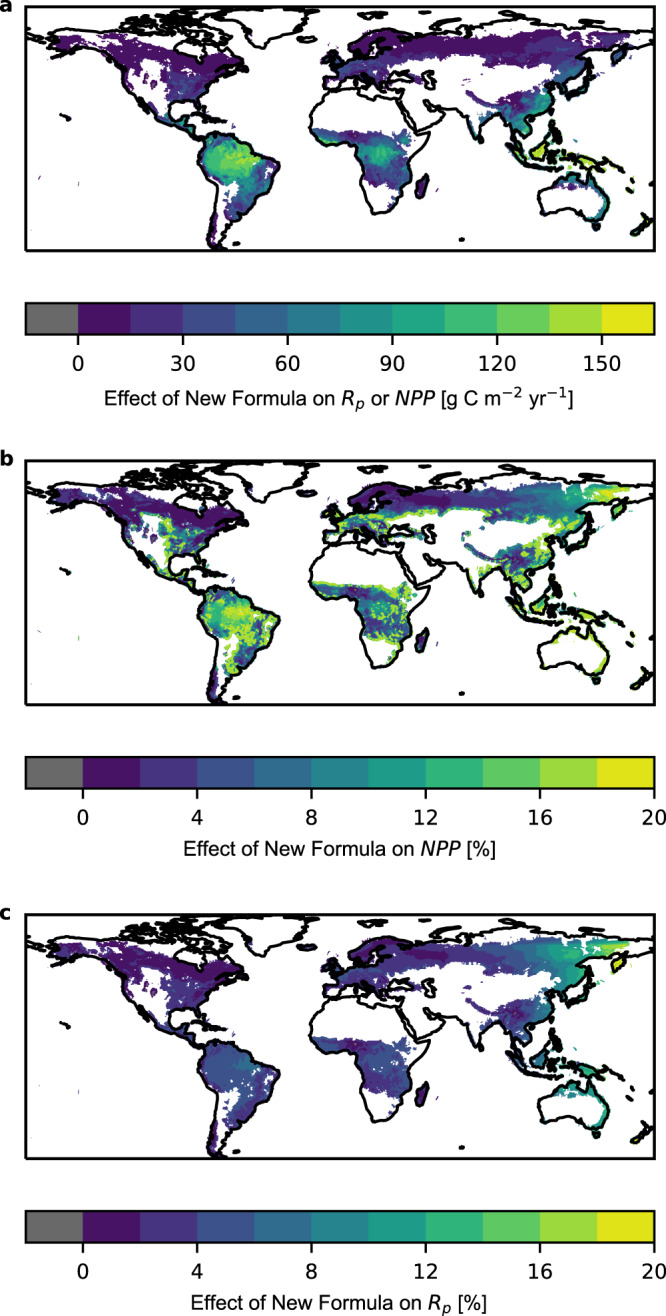
Fig. 3. Global modelling of RP and NPP.

Impact of incorporation of nocturnal variation in whole plant RTo in a simulated reduction in plant respiration Rp (a, c) and a corresponding increase in NPP (b) over the period 2000–2018 using the standard model with Q10 = 2 (Equation 1) and the new formula (Equation 4). The impact is estimated as the difference between the temporal mean of simulations with and without nocturnal variation in whole plant RTo (respiration rate at constant temperature) for NPP (net primary production) and vice versa for Rp (plant respiration rate) (a) and as a percentage of simulations without nocturnal variation in RTo (b, c). Note, that the reduction in Rp (a) is identical to the increase in NPP in absolute terms. Results are presented for grid cells where grid level NPP is >50 g m−2 yr −1 in the standard simulations with Q10 = 2 (the relative change in R obtained with a 10 °C change in T) to avoid excessively large % effects at very low NPP.
