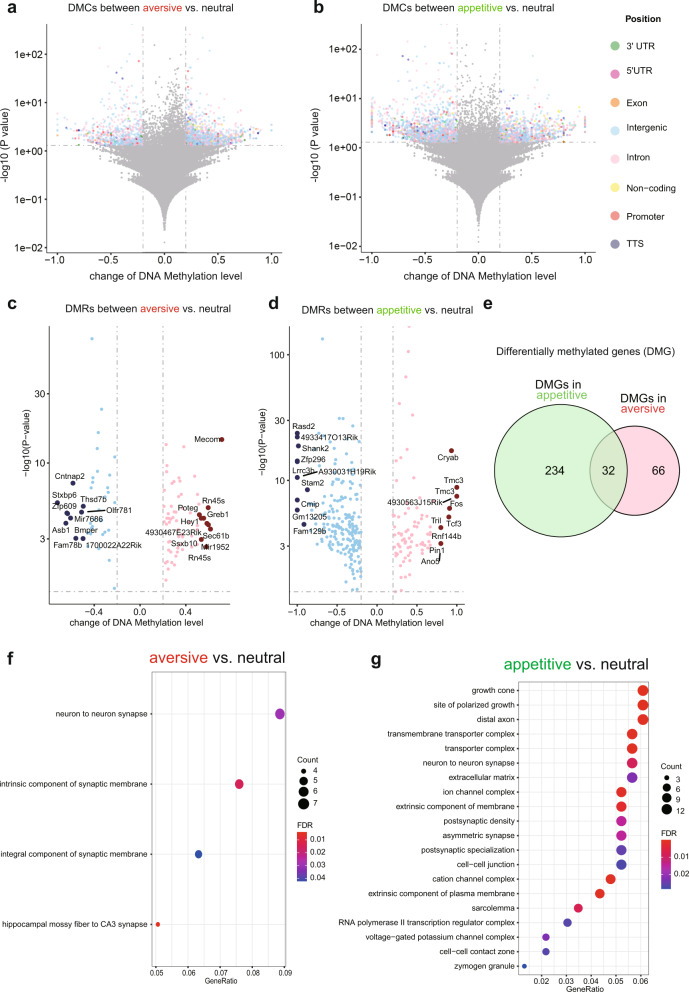
Fig. 5. Distinct DNA methylation landscapes of aversive and appetitive vCA1 cells.
Volcano plots showing the differentially methylated cytosines (DMC) with the change of DNA methylation larger than 20% and p value smaller than 0.05 in aversive a, or appetitive b, vCA1 cells compared to the neutral group. DMCs in different genomic positions (3’UTR, 5’UTR, exon, intergenic, intron, non-coding promotor, TSS) are color coded. Volcano plot showing differently methylated regions (DMRs) that contain at least two DMCs for each DMR in aversive c, and appetitive d, vCA1 cells. The top 10 hypermethylated and hypomethylated regions were highlighted in either pink or blue separately and were annotated to its nearest genes. e A Venn diagram showing differently methylated genes (DMGs) that are associated with DMRs in c and d identified in aversive and appetitive vCA1 cells. f, GO analysis of DMGs in aversive vCA1 cells. g GO analysis of DMGs in appetitive vCA1 cells.

