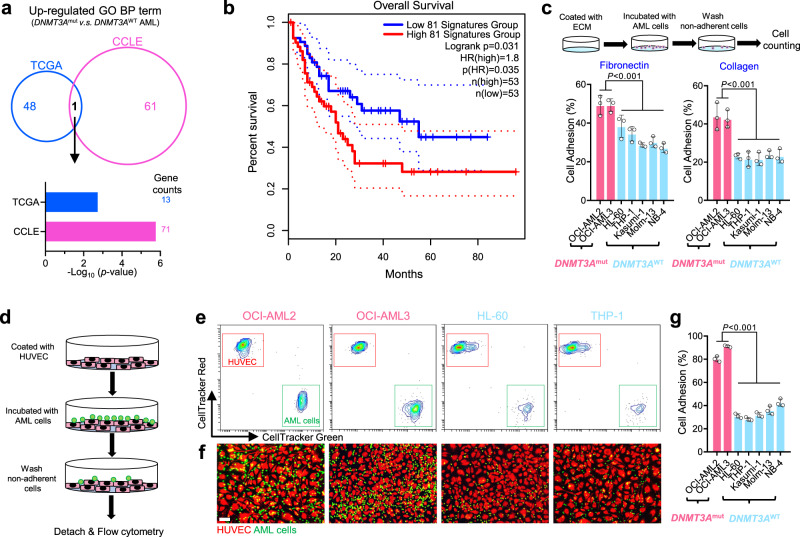
Fig. 1. Cell adhesion was predominantly enriched in DNMT3A mutant AML cells.
a Venn diagram of up-regulated BP terms in DNMT3A-mutant AML cells from both AML patients (TCGA: DNMT3Amut, n = 36; DNMT3Awt, n = 115) and AML cell lines (CCLE: DNMT3Amut, n = 4; DNMT3Awt, n = 30). b Survival curves of AML patients with high and low expression designated gene set, and n is the number of biologically independent samples. The survival analysis was performed by the log-rank (Mantel–Cox) test. c Cell adhesion assay for human AML cells seeded on fibronectin or collagen. n = 3 biologically independent experiments. d Cell-cell adhesion between human AML cells and HUVECs. e Representative flow cytometry results for cell-cell adhesion between human AML cells and HUVECs. f Representative fluorescent image for cell-cell adhesion between human AML cells and HUVECs. Scale bar, 50 μm. g Statistical results for cell-cell adhesion between human AML cells and HUVECs. n = 3 biologically independent experiments. The data were shown as the mean ± SD. Statistical significance was tested with One-way ANOVA. Source data are provided as a Source Data file.

