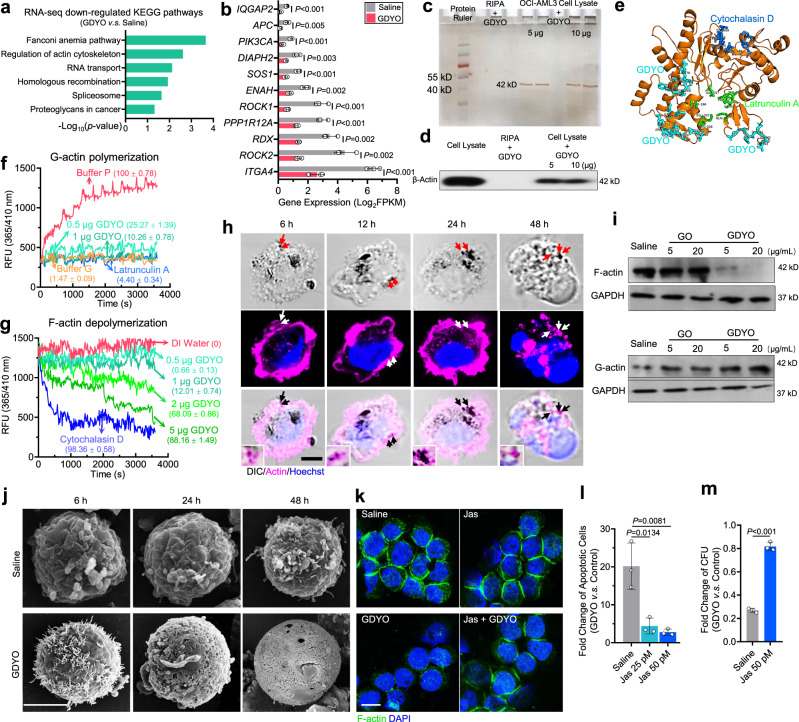
Fig. 5. GDYO dampened F-actin organization in DNMT3A mutant AML cells.
a KEGG analysis of down-regulated genes in GDYO-treated OCI-AML3 cells. b Fragments Per Kilobase per Million (FPKMs) of genes related in actin cytoskeleton in control and GDYO groups. n = 3 biologically independent experiments. c Silver staining of SDS-PAGE gel loaded with GDYO-treated cell lysates. d Antibody-guided immunoblot for binding ability between β-actin and GDYO nanosheets. e Simulated binding site of GDYO (cyan), cytochalasin D (green) and latrunculin A (blue) onto the actin monomer. f-g G-actin polymerization (f) and F-actin depolymerization (g) curves treated with GDYO, cytochalasin D and latrunculin A. The numbers in brackets indicated the percentages of polymerization or depolymerization (%). h Live cell imaging of actin with DIC component in GDYO-treated OCI-AML3 cells. Arrows indicated the co-localizations of GDYO nanosheets and actin. Scale bar, 5 μm. i Western blot analysis of F-actin and G-actin after GO or GDYO treatment. j Representative SEM images of OCI-AML3 treated by GO or GDYO for 6, 24 and 48 h. Scale bar, 5 μm. k Representative F-actin immunofluorescence confocal images of OCI-AML3 treated by saline, Jas, GDYO, Jas and GDYO for 48 h. Scale bar, 10 μm. l-m Fold change of apoptosis (l) and CFU (m) for GDYO v.s. control is rescued by Jas. n = 3 biologically independent experiments. The data were shown as the mean ± SD. Statistical significance was tested with a two-tailed, unpaired Student’s t test. Source data are provided as a Source Data file.

