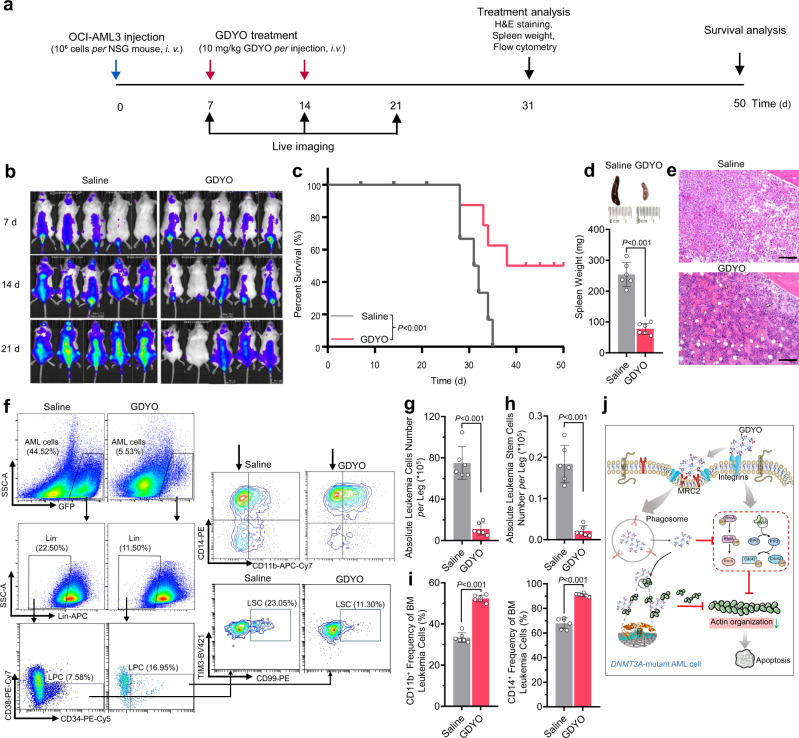
Fig. 6. GDYO exhibited in vivo therapeutic potential against DNMT3A mutant AML cells.
a Schematic illustration of the experimental design. b Representative IVIS spectrum images. n = 5 biologically independent animals. c Kaplan-Meier survival curve of AML mice injected with saline or GDYO. n = 8 biologically independent animals. d Spleen weight of AML mice injected with saline or GDYO at sacrifice. n = 6 biologically independent animals. e Bone marrow H&E sections of AML mice injected with saline or GDYO at sacrifice. Scale bar, 100 μm. f Representative flow cytometry images of BM total mononuclear cells. g-i Absolute number of leukemia cells (g) and absolute number of leukemia stem cells (h) in BM from AML mice injected with saline or GDYO. n = 6 biologically independent animals. i Myeloid differentiation (CD11b+/CD14+) of BM leukemia cells from AML mice injected with saline or GDYO. n = 6 biologically independent animals. j Illustration for GDYO therapy against DNMT3A-mutant AML cell. The data were shown as the mean ± SD. Statistical significance was tested with a two-tailed, unpaired Student’s t test. Source data are provided as a Source Data file.

