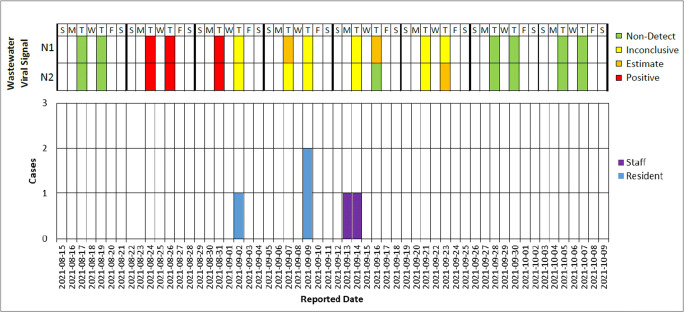
Fig. 1.
Wastewater surveillance signal (top panel) and epidemic curve of confirmed cases by role (bottom panel) at a shelter outbreak, Toronto, August 24–October 7, 2021 (n = 5). Non-detect: The qPCR did not produce any value. Inconclusive: The raw Ct value fell outside the linear range of the standard curve and was above the y-intercept of the standard curve. Estimate: The raw Ct value fell outside the linear range of the standard curve, and the value was between the y-intercept of the standard curve and the limit of detection (LOD). Positive: The raw Ct value was within the linear range of the standard curve. Reported date: The date the case was reported to TPH

