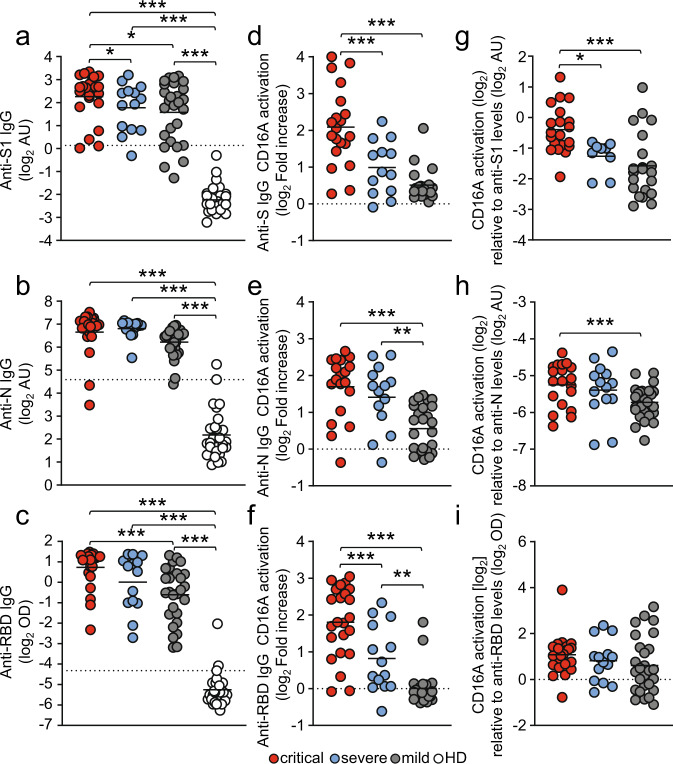
Fig. 2. FcγRIIIA/CD16A activation by SARS-CoV-2 - specific IgG is enhanced in critically diseased patients.
FcγRIIIA/CD16A activation of BW5147 reporter cells by SARS-CoV-2-specific IgG in serum samples obtained 13-25 days following symptom onset from 23 critically (red symbols) and 14 severely (blue symbols) diseased patients. Between 2 to 8 samples/patient were analyzed depending on the availability of sample material. Sera from 28 non-hospitalized patients with mild SARS-CoV-2 infection (grey symbols) and 30 healthy donors (open circles) served as reference. Each symbol represents the mean value of all available samples per patient. a–c ELISA levels for S1-, N- and RBD-specific IgG. Dotted lines represent cut-off values for commercial S1-, N- and RBD - specific ELISA assays. d–f FcγRIIIA/CD16A activation by S-, N- and RBD-specific IgG expressed as log2 fold change relative to negative control. g–i FcγRIIIA/CD16A activation, expressed as log2 values relative to SARS-CoV-2-spcific IgG titers. Solid black lines indicate the mean. Significant differences over all three groups were tested by ANOVA and pairwise group comparison was made by Games-Howell post-hoc tests (***p < 0.001; **p < 0.01, *p < 0.05). Source data are provided as a Source Data file.

