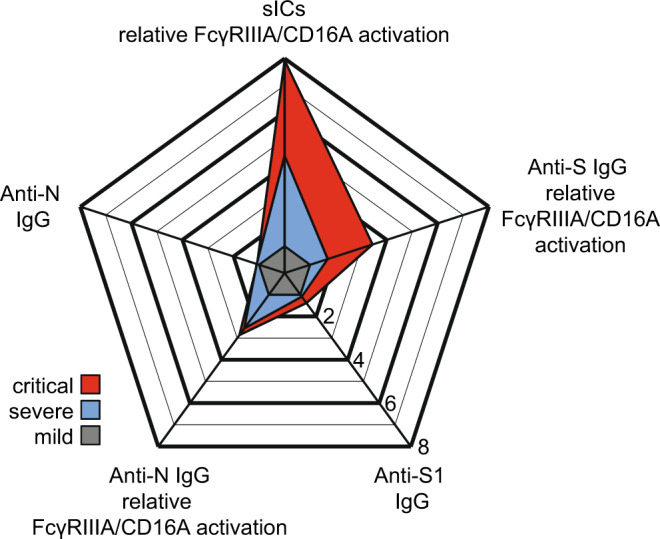
Fig. 5. Summary of antibody features from SARS-CoV-2-infected patients with critical and severe disease.

Relative multivariate antibody features illustrated as radar chart in critically (red) or severely (blue) diseased COVID-19 patients normalized to the corresponding features of patients with mild infection (grey). Each spoke represents one of the following variables: ELISA (S1-IgG, N-IgG,) and CD16 activation (S-IgG, N-IgG, multimeric sICs). Arithmetic mean values of log2 values were calculated for each group (days 13-25 post symptom onset), respectively. The fold change compared to mildly diseased patients is shown. Source data are provided as a Source Data file.
