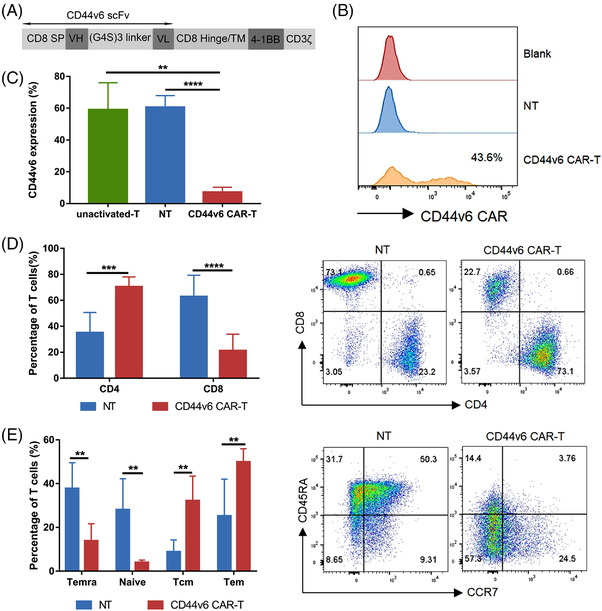
FIGURE 2.

CD44v6 CAR‐T cells construction and characterization. (A) Schematic structure of the CD44v6 CAR. (B) Transduction efficiencies of primary activated T cells 7 days after transduction were analysed by flow cytometry. (C) CD44v6 expression on not activated T (unactivated‐T), non‐transduced (NT, activated) cells and CD44v6 CAR‐T cells 7 days after transduction was analysed by flow cytometry (n = 5). (D) The ratio of CD4+ and CD8+ T cells in NT or CD44v6 CAR‐T cells 14 days after transduction was detected by flow cytometry (n = 6). (E) CCR7 and CD45RA surface staining was performed on both NT and CD44v6 CAR‐T cells 14 days after transduction (n = 5). Tcm, central memory, CCR7+CD45R−; Tem, effector memory, CCR7−CD45RA−; Temra, terminally differentiated effector memory, CCR7−CD45RA+; Naive, CCR7+CD45RA+. Bar are depicted as the mean ± SD. ***p < .001; ****p < .0001
