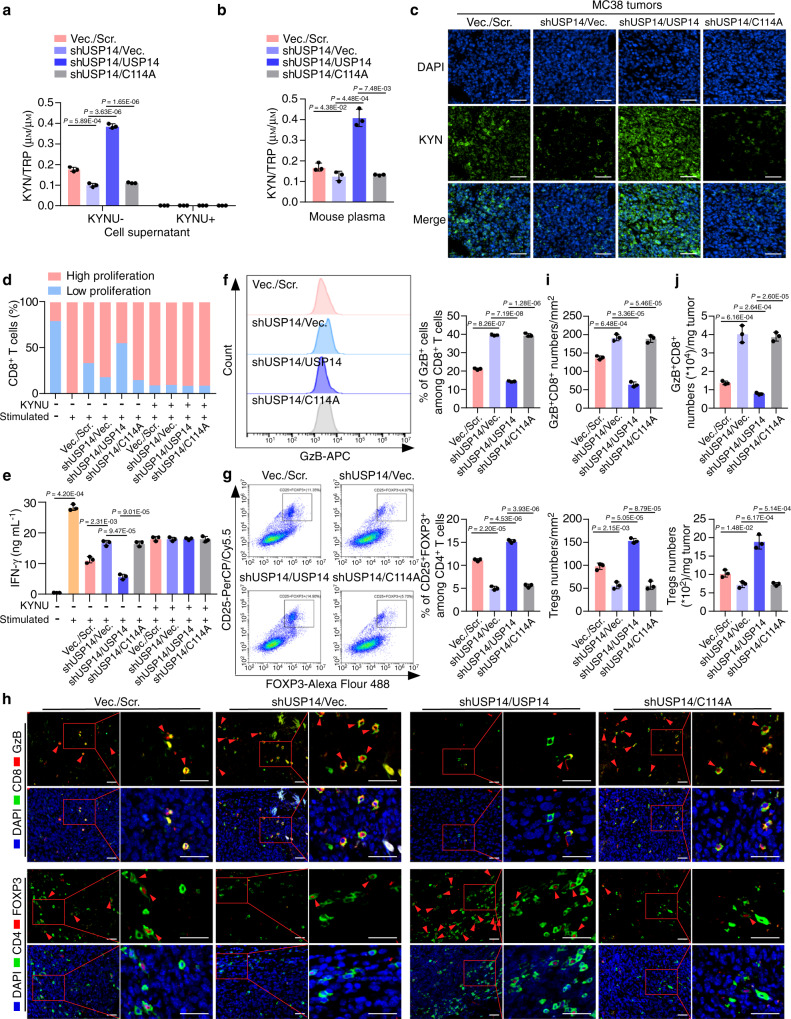
Fig. 5. USP14 deficiency reverses immune suppression without activating AhR signaling.
a MC38-Vec./Scr., MC38-shUSP14/Vec., MC38-shUSP14/USP14, and MC38-shUSP14/C114A cells were cultured for 24 h with or without KYNU treatment. KYN and TRP levels in cell supernatants were determined by ELISA (n = 3 biological replicates). b MC38-Vec./Scr., MC38-shUSP14/Vec., MC38-shUSP14/USP14, and MC38-shUSP14/C114A cells were injected subcutaneously into C57BL/6 J mice at day 0. HPLC-MS/MS analysis was used to generate the tryptophan metabolomic profiles of mouse plasma at day 21, and the KYN/TRP ratio in the mouse plasma was calculated (n = 3 biological replicates). c Representative immunofluorescence images of the indicated mouse tumors stained with antibodies against KYN. Scale bars, 100 µm. d Quantification of the proliferation of splenic CD8+ T cells cultured in the supernatants of the indicated tumor cells. Unstimulated T cells were used as a negative control (n = 3 biological replicates). e IFN-γ secretion by splenic CD8+ T cells cultured in supernatants of the indicated tumor cells, measured by ELISA (n = 3 biological replicates). f, g The percentage of GzB+ cells in CD8+ T cells (f) and CD25+FOXP3+ cells in CD4+ T cells (g) isolated from the indicated tumors was measured by flow cytometry and analyzed by FlowJo software. h, i Representative images and quantification of GzB+CD8+ cells and FOXP3+CD4+ cells analyzed by IF staining in tumors (n = 3 biological replicates). The small red boxed areas were amplified images of cells. Multiple GzB+CD8+ cells and FOXP3+CD4+ cells were marked with red arrowheads. The far-right images in each panel were close-ups of the boxed region. Scale bars, 50 µm. j The percentage of GzB+CD8+ T cells and CD4+CD25+FOXP3+ T cells per milligram of the indicated tumors was measured by flow cytometry and analyzed by FlowJo software (n = 3 biological replicates). In a, b, e–g, i, and j, error bars represent the mean ± SD of three independent experiments, two-sided Student’s t-test. GzB Granzyme B. Source data are provided as a Source Data file.

