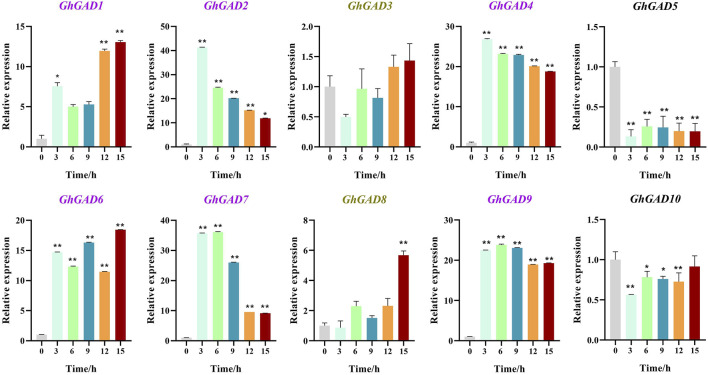
FIGURE 8.
Expression analysis of GhGAD gene family at different Cd2+ treatment times. The bar graphs represent the relative expression levels of GAD family genes in roots under Cd2+ stress for 0, 3, 6, 9, 12, and 15 h (*0.01 < p < 0.05, **p < 0.01); the resulting mean values were presented as relative units. Error bar represents SD.

