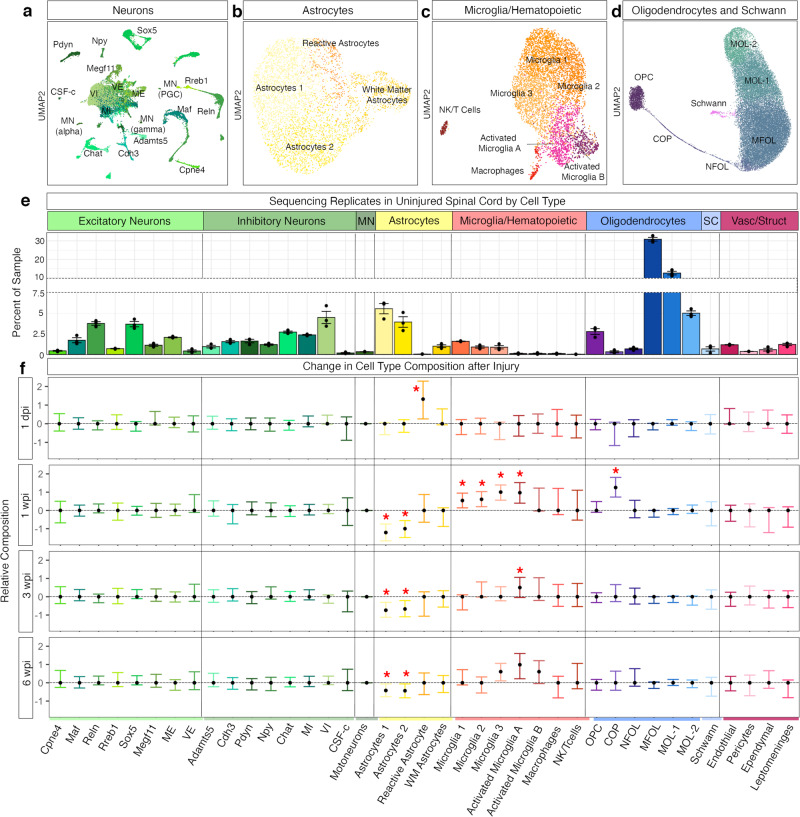
Fig. 2. Cell type composition in the uninjured spinal cord and after injury.
a–d UMAPs depicting subclustering of major cell types: a neurons, b astrocytes, c microglia/hematopoietic cells, d oligodendrocyte lineage and Schwann cells. e A bar plot showing the 39 cell types in the atlas and their relative percent in each sample in the uninjured spinal cord. Individual replicates (N = 3) are shown as well as mean ± SEM. f The relative composition of the 39 cell types comparing injured samples (1 dpi, 1 wpi, 3 wpi, and 6 wpi) to uninjured, generated using scCODA showing the final parameter output from scCODA (confidence interval shown as 3–97% high-density index around the mean). Cell types with an inclusion probability > 0.85 were deemed significant. Significance depicted with a red asterisk. N = 3. For the log FC of individual replicates, see Supplementary Fig. 8. Source data are provided as a Source Data file.

