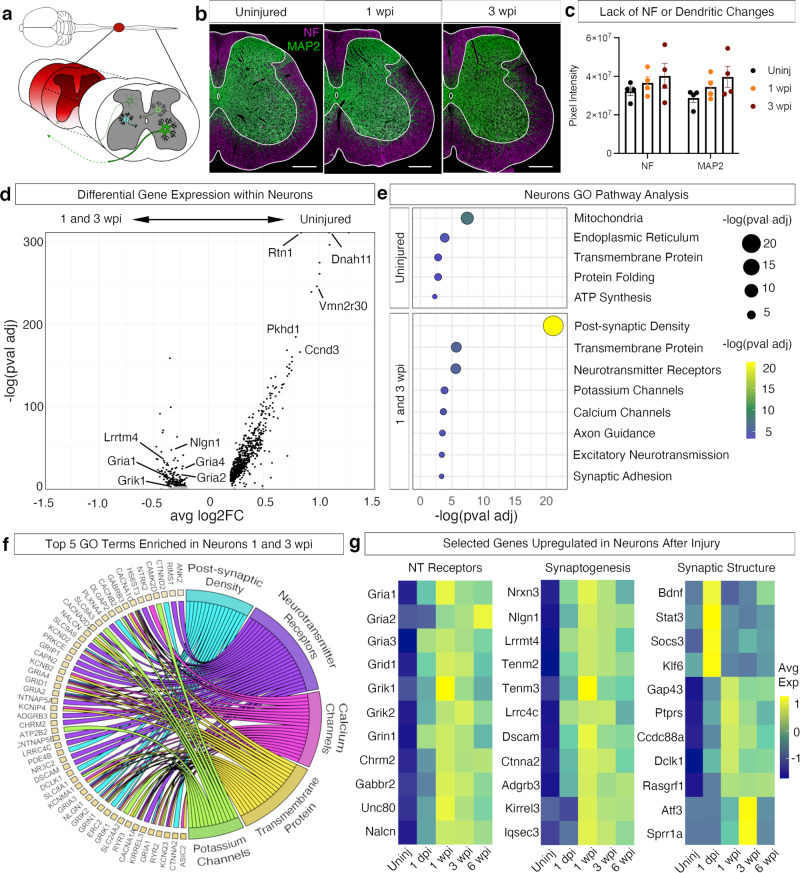
Fig. 3. Plasticity-related expression in neurons after injury.
a Schematic depicting lumbar spinal cord neurons and their response to injury, whether that be an ascending neuron or an interneuron. b Immunohistochemistry of the lumbar spinal cord from uninjured, 1 wpi and 3 wpi. Tissue was stained for neurofilament (a cocktail of neurofilament-light, neurofilament-medium, neurofilament-heavy; purple) and MAP2 (green). Scale bars are 200 µm. c Quantification of neurofilament and dendritic changes. Pixels were quantified from thresholded images of neurofilament and MAP2. Error bars are mean ± SEM (N = 4). d Differential gene expression analysis comparing uninjured to 1 and 3 wpi neurons, the time points of maximal neuronal gene expression changes. Black dots indicate p value adjusted < 0.001, gray indicate p ≥ 0.001. e Pathway analysis for differentially expressed genes between uninjured and injured time points. X-axis indicates −log(p val adj) of GO and KEGG pathway clusters. P values (adjusted) were calculated using Benjamini–Hochberg false discovery rate (FDR). Yellow indicates relatively high normalized average expression and dark blue indicates relatively low normalized average expression. f Chord plot indicating shared genes between top 5 GO terms from genes upregulated 1 and 3 wpi. g Heatmaps showing average neuronal gene expression from top GO terms, including neurotransmitter receptors, synaptogenesis, and synaptic structure. Yellow indicates relatively high normalized average expression (1) and dark blue indicates relatively low normalized average expression (−1).

