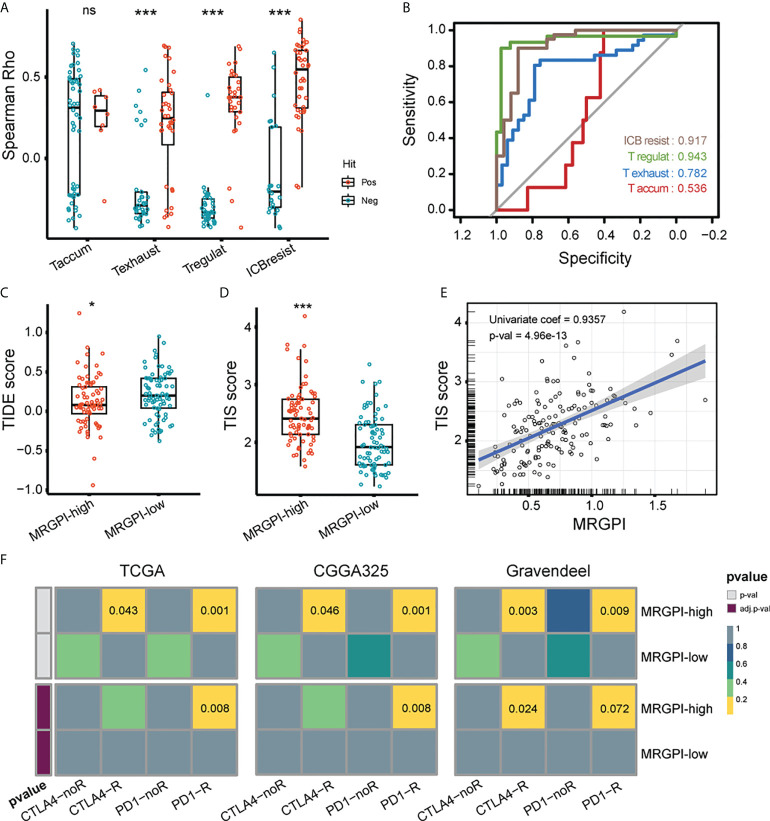
Figure 6.
Potential of MRGPI in predicting ICB responsiveness. (A) Association between MRGPI and T cell dysfunction-related genes. To achieve this, 4 published gene signatures related to T cell dysfunction were collected and screened. The Spearman rho of positive (red) and negative (green) hit genes with MRGPI was exhibited. The difference in rho between positive and negative groups was compared through the two-sided Wilcoxon test. Taccum, T cell accumulation; Texhaust, T cell exhaustion; Tregulat, regulatory T cell; ICBresist, ICB resistance. (B) ROC curves evaluating the performance of MRGPI in predicting the positive and negative hit gene associated with T cell function. (C) TIDE score between the MRGPI-high and -low groups. (D) TIS score between the MRGPI-high and -low groups. (E) Correlation between the MRGPI and TIS score. (F) Submap algorithm manifested association between MRGPI-based groups and sample responsiveness to PD-1 and CTLA4 inhibitors. ***p < 0.001. ns, non significant.

