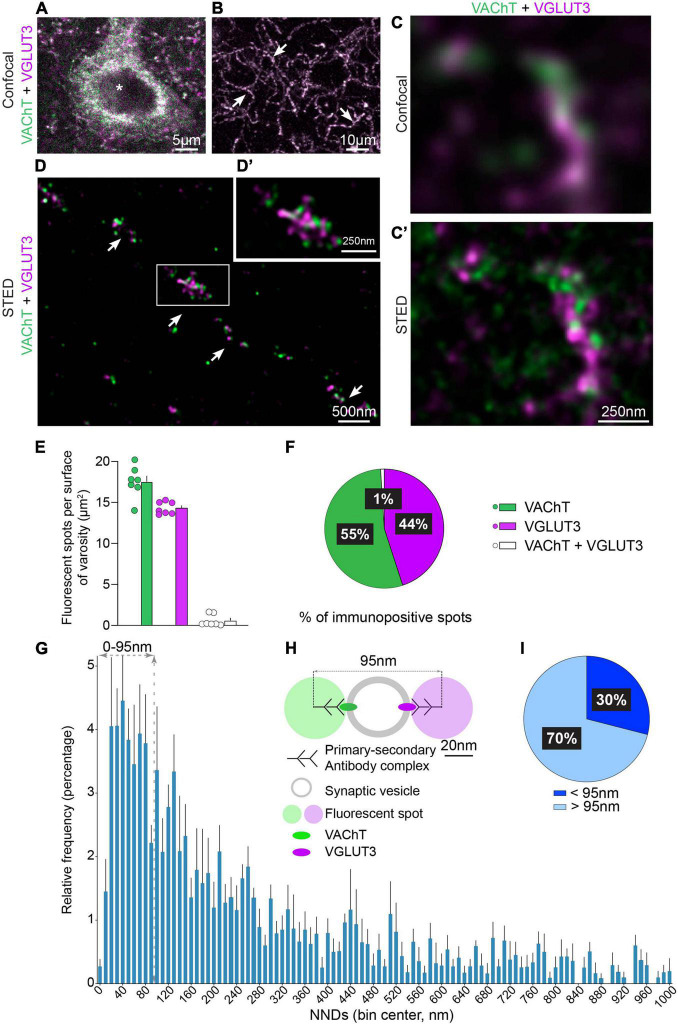
FIGURE 1.
Immunofluorescent detection of VAChT and VGLUT3 in the mouse dorsolateral striatum (DLS) with confocal and STED microscopy. (A,B) VAChT and VGLUT3 are co-detected in the cell body of a striatal neuron (*in A) and in axonal varicosities (arrows in B). (C,C′) The same axonal varicosity observed by confocal microscopy (C) and by STED microscopy (C′). (D,D′) Axon and varicosities (arrows in D) of a CINs observed with STED microscopy. (E) Quantification of VAChT-, VGLUT3- and VAChT + VGLUT3-immunopositive spots per varicosity surface. (F) Manual quantification of the distribution per varicosity of VAChT, VGLUT3 and VAChT + VGLUT3 immunopositive spots. (E,F) Quantification from 7 mice, 3 sections per animal, 155 varicosities, 2,883 spots in total. (G) Batch analysis of NND between VAChT- and VGLUT3-immunofluorescent spots by STED microscopy per 10 nm bins. (H) Schematic representation to estimate the cut-off for considering that VAChT and VGLUT3 are present or not on the same SV. This estimation is based on the steric hindrance of the primary/secondary antibody complex (45 nm) and the mean diameter of the SV (50 nm). (I) Percentage of VAChT spots displaying a NND with their closest VGLUT3 spot above and below 95 nm. (G,I) Quantification from 5 microscopic fields (625 μm2), analysis of 914 pairs of immunofluorescent spots for VAChT and VGLUT3. VAChT-VGLUT3 pairs were identified in a radius of 1,000 nm. Data are expressed as means ± SEM. (A–D′) Fluorochromes: Alexa 594 (VAChT, green) and Abberior Star 635P (VGLUT3, purple).

