FIGURE 2.
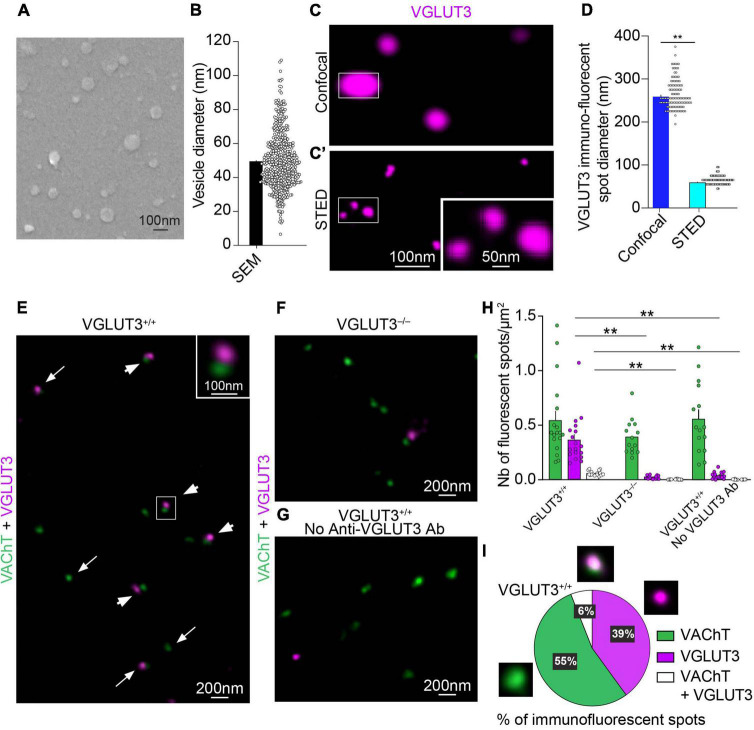
Immunohistochemical detection of VAChT and VGLUT3 on isolated mouse striatal synaptic vesicles with confocal, STED and electron microscopy. (A) Scanning electron microscopy (SEM) of striatal SVs covered with a 5 nm layer of platinum. (B) Quantification of the mean diameter of SVs observed by SEM (n = 484 SVs). (C,C′) The same isolated SVs immunofluorescent for VGLUT3 observed by confocal microscopy (C) and by STED microscopy (C′). One spot observed under the confocal microscope correspond to three spots when observed under the STED microscope (insets in C,C′). (D) Quantification of the mean diameter of VGLUT3 fluorescent spots with confocal or STED microscopy (n = 110 from 20 animals). Wilcoxon matched-pairs signed rank test, **p < 0.0001. (E–G) Simultaneous immunofluorescent detection with STED microscopy of VAChT- and VGLUT3-immunofluorescent spots on isolated mouse striatal SVs from VGLUT3+/+ mice (E,G) or VGLUT3– /– mice (F) in the presence (E,F) or absence (G) of anti-VGLUT3 antiserum. (E) In VGLUT3+/+ vesicles, some VAChT- and VGLUT3-immunofluorescent spots appear isolated (arrows in E) whereas other spots are close (arrowheads and inset). (H) Automatized quantification of the number of VAChT-, VGLUT3- and VAChT + VGLUT3-immunofluorescent spots by surface of coverslip from n = 19 microscopic fields (625 μm2) from vesicle preparation from 20 animals in three independent experiments. Kruskal-Wallis test followed by the Dunn’s post-hoc test, **p < 0.0001. (I) Manual quantification of VAChT-, VGLUT3 or VAChT + VGLUT3-immunopositive spots per surface of coverslip. Data are expressed as means ± SEM. (C,C′,E–G) Fluorochromes: Alexa 594 (VAChT) and Abberior Star 635P (VGLUT3).

