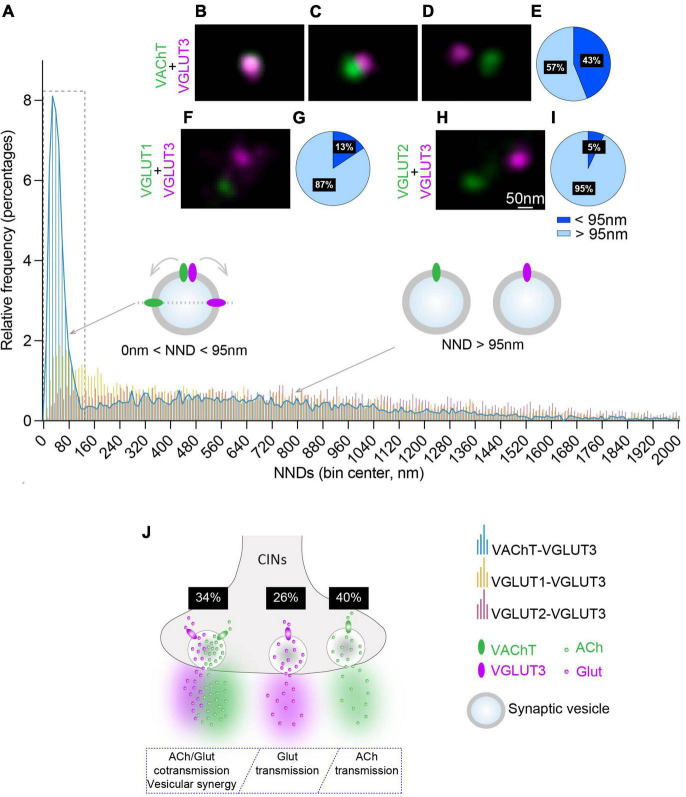
FIGURE 3.
Quantitative analysis of the NNDs between VAChT, VGLUT1 or VGLUT2 and VGLUT3-immunofluorescent spots on striatal isolated SVs. (A) Quantification and frequency histograms of the NND between the centers of VAChT, VGLUT1 or VGLUT2-immunofluorescent spots and their closest VGLUT3 spots. A total of 7,048, 6,017, and 6,827 pairs of VAChT/VGLUT3, VGLUT1/VGLUT3, and VGLUT2/VGLUT3 immunofluorescent spots, respectively, were analyzed in 3 independent experiments. (B–D) Examples of VGLUT3- and VAChT-fluorescent spots superposed (B), juxtaposed (C) or separated (D). (F,H) Examples of VGLUT1/VGLUT3 (F) and VGLUT2/VGLUT3 (H) fluorescent spots. (E,G,I) Percentage of VAChT, VGLUT1 or VGLUT2 spots displaying a NND with their closest VGLUT3 spot above and below 95 nm. (J) Hypothetical model of the distribution of VGLUT3 and VAChT in SVs from CINs varicosities and estimation of the proportion of VAChT + VGLUT3-, VAChT- alone, and VGLUT3- alone SVs in CINs varicosities. (B–D,F,H) Fluorochromes: Alexa 594 (VAChT,VGLUT1,VGLUT2) and Abberior Star 635P (VGLUT3).

