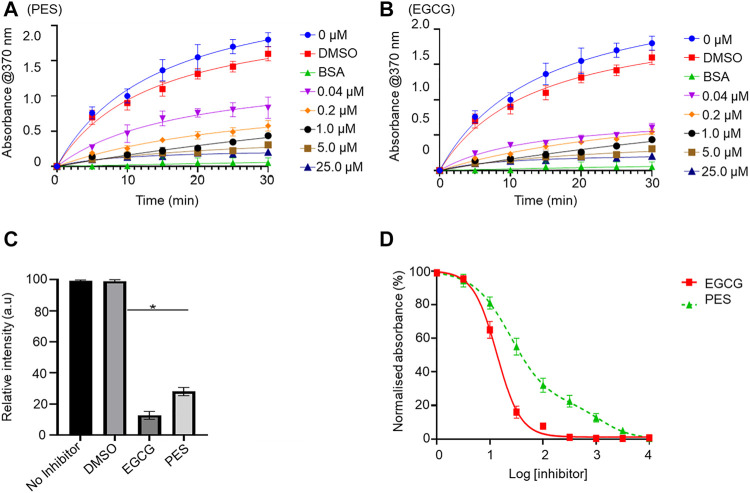
FIGURE 7.
PES suppresses PfHop-PfHsp70-1 association. PfHsp70-1 was immobilized onto the ELISA plate and PfHop (analyte) was suspended along with varying concentrations of PES. DMSO and BSA were used as controls. Representative binding curves obtained for the association of PfHsp70-1 and PfHop in the presence of (A) PES and EGCG (B) are shown. Bar graphs showing the comparative effects of the inhibitors on the interaction of PfHsp70-1 and PfHop are provided (C). The resultant dose-response curves for both PES and EGCG are shown (D). The error bars represent the standard deviations obtained from three independent assays conducted independently. Student t-test statistical significance of differences of inhibitor compared to the vehicle control, DMSO, are indicated by asterisks positioned above the bar graphs (p < 0.001*).

