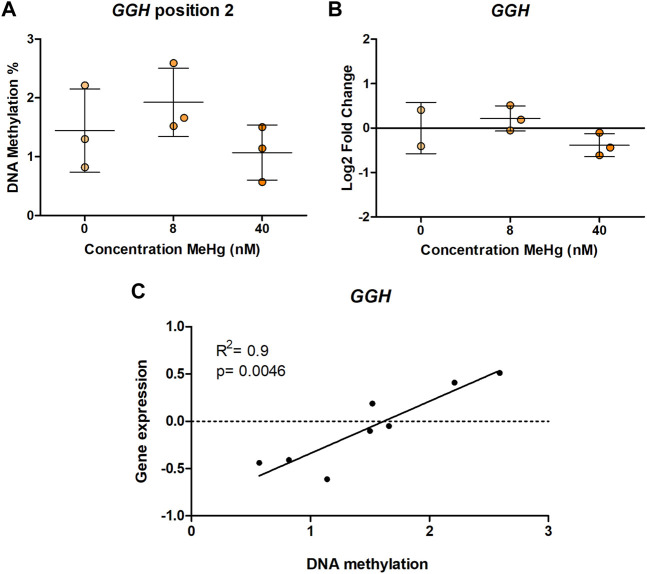
FIGURE 2.
GGH DNA methylation and gene expression in MeHg-exposed SH-SY5Y cells; (A) DNA methylation levels, (B) gene expression, and (C) Spearman correlation between gene expression and DNA methylation. The results are presented as the mean ± SD of three independent biological replicates and were analyzed with One-way Analysis of variance (ANOVA) with Dunnett’s post-hoc test. Statistical significance was considered when the p-value was below 0.05.

