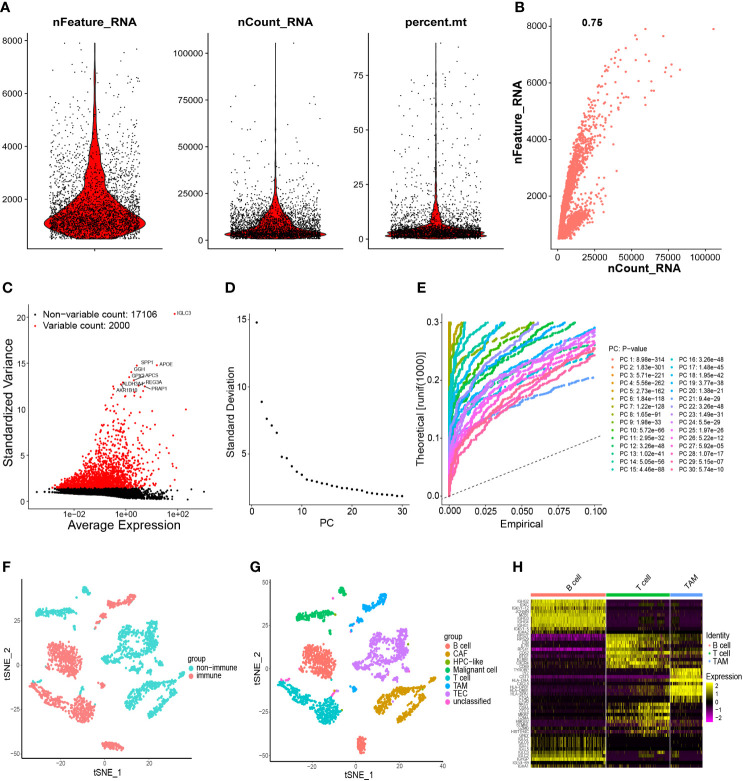
Figure 3.
Processing of scRNA-seq data and acquisition of TAM marker genes. (A) Quality control of scRNA-seq data of samples of HCC cells. (B) The number of genes detected was positively associated with the depth of sequencing. (C) Scatter plots showing the top-2000 differentially expressed genes. (D, E) Principal component analysis was employed to classify the cells, and the top-30 PCs are displayed. (F) Initially, cells were annotated as “immune cells” and “non-immune cells” by the t-SNE algorithm. (G) Further detailed annotation of cells. (H) Heatmap demonstrated the marker genes with differential expression in immune cells. scRNA-seq, single-cell RNA-seq; TAM, tumor-associated macrophage; HCC, hepatocellular carcinoma; PCs, principal components; t-SNE, t-distributed stochastic neighbor embedding.

