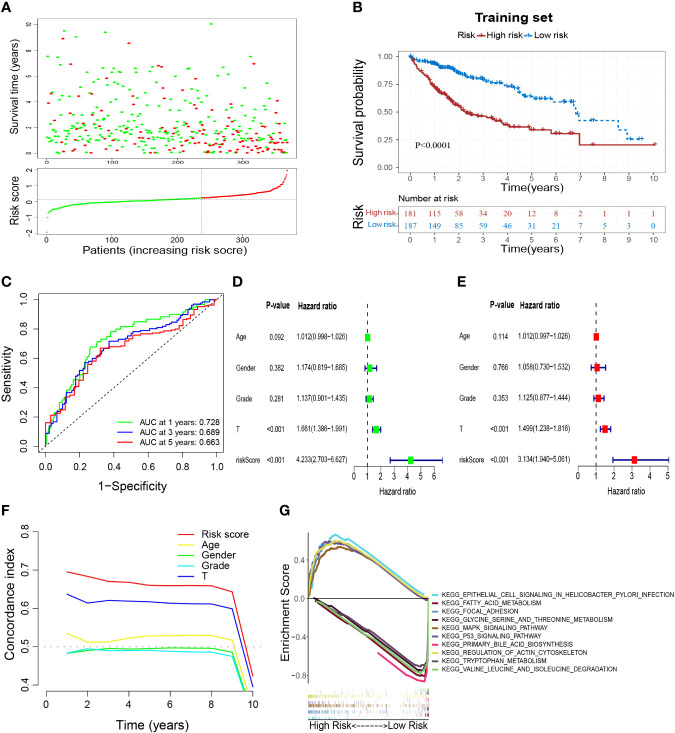
Figure 5.
Construction of a M2-like TAM-related prognostic signature. (A) Survival status and risk scores of HCC patients in high- and low-risk groups in the training set. Green dots denote low risk and red dots denote high risk. (B) Kaplan–Meier survival curves showed a significantly worse prognosis for the high-risk group in the training set. (C) ROC curves for 1, 3, and 5 years and their AUCs. (D–F) The results of univariate analysis, multivariate analysis, and C-index indicated that risk score was an independent risk factor influencing survival status in preference to other indicators. (G) Results of GSEA analysis. TAM, tumor-associated macrophage; HCC, hepatocellular carcinoma; ROC, receiver operator characteristic; AUC, area under curve; C-index, Concordance index; GSEA, gene set enrichment analysis.

