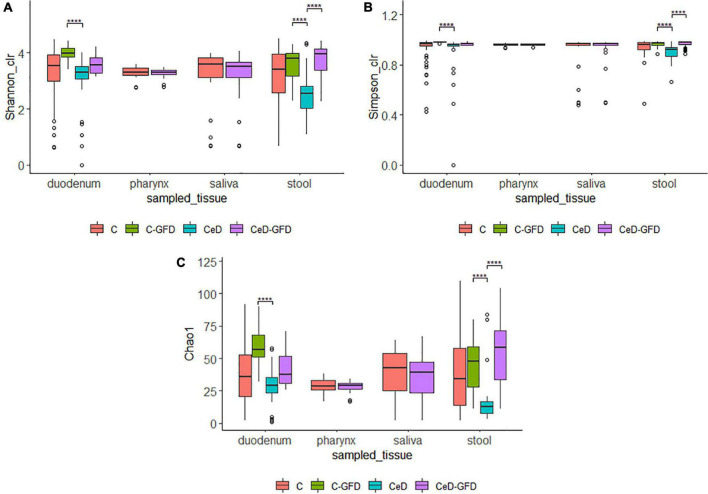
FIGURE 1.
Shannon (A), Simpson (B), and Chao1 (C) diversity indices for (1) the pooled samples in cases and controls for each sampled tissue according to diet. The p-value was calculated using the Wilcoxon test in (A,B) and the Welch’s t-test in (C). The limits of the rectangle indicate the 25th and 75th percentiles and the horizontal bars indicate the median, in (C), the median equals average. Vertical bars indicate upper and lower distribution limits, and dots represent mild outliers. ****P < 0.0001.

