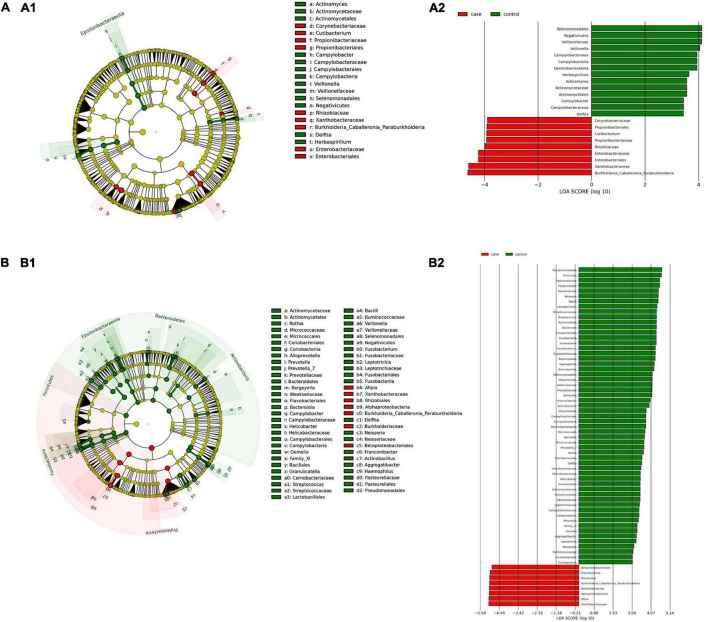
FIGURE 3.
Linear discriminant analysis (LDA) integrated with effect size (LEfSe). Cladogram representing the differentially abundant taxonomic groups in the microbiota from the duodenum of CeD following an unrestricted diet (A1) or a GFD (B1). Graph bar representing the microbial biomarkers found in the microbiota from the duodenum of CeD following an unrestricted diet (A2) or Patients with CeD following a GFD (B2) (LDA score > 3, p < 0.001). Control: Control group, represented in green. Case: Patients with CeD, represented in red.

