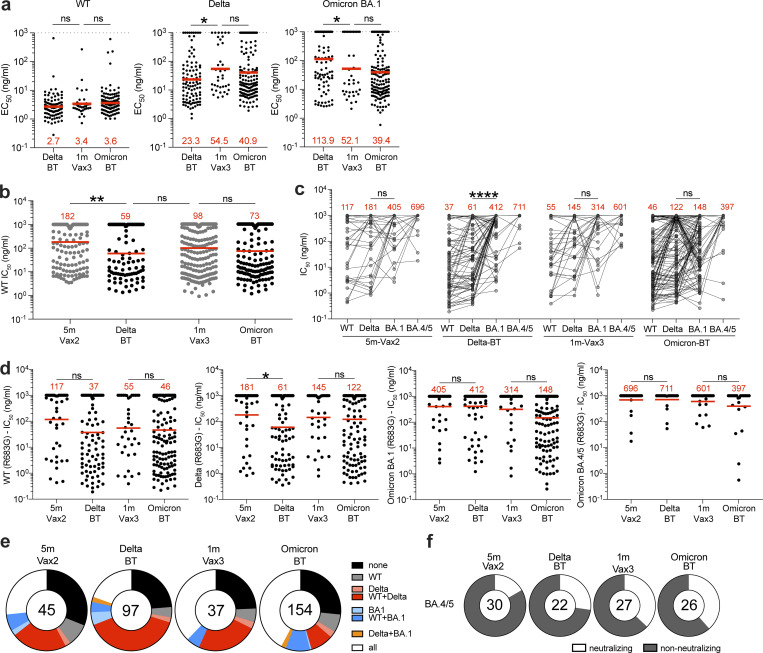
Figure 3.
Anti–SARS-CoV-2 RBD mAbs. (a) Graphs show EC50 of n = 342 mAbs measured by ELISA against WT-RBD, Delta-RBD, and Omicron BA.1-spike protein. Antibodies were obtained from MBCs after Delta breakthrough (Delta BT), after mRNA Vax3, and Omicron breakthrough (Omicron BT). (b) Graph shows anti–SARS-CoV-2–neutralizing activity of mAbs measured by a SARS-CoV-2 pseudotype virus neutralization assay using WT SARS-CoV-2 pseudovirus. IC50 values for all antibodies including the 288 reported and tested herein, and 350 previously reported (Cho et al., 2021; Muecksch et al., 2022). (c and d) Graphs show IC50s of mAbs against WT, Delta-RBD, and Omicron BA.1 SARS-CoV-2 pseudoviruses. Each dot represents one antibody, where 333 total antibodies were tested including the 288 reported herein, and 45 5 m-Vax2 antibodies previously reported (Cho et al., 2021; Muecksch et al., 2022). Red values represent geometric mean values. In addition, 105 antibodies distributed over all four cohorts were also tested against Omicron BA.4/5 psuedovirus. (e) Ring plots show fraction of neutralizing (IC50 <1,000 ng/ml) antibodies against WT, Delta-RBD, and Omicron BA.1 SARS-CoV-2 pseudoviruses, and non-neutralizing (IC50 >1,000 ng/ml) antibodies from each time point. (f) Ring plots show fraction of mAbs that are neutralizing (IC50 1–1,000 ng/ml, white) or non-neutralizing (IC50 >1,000 ng/ml, black) against Omicron BA.4/5. Number in inner circles indicates number of antibodies tested. The deletions/substitutions corresponding to viral variants used in panels c–f were incorporated into a spike protein that also includes the R683G substitution, which disrupts the furin cleavage site and increases particle infectivity. Neutralizing activity against mutant pseudoviruses was compared to a WT SARS-CoV-2 spike sequence (NC_045512), carrying R683G where appropriate. All experiments were performed at least in duplicate and repeated twice. Red bars and values in panels a, b, and d represent geometric mean values. Statistical significance in panels a and b was determined by two-tailed Kruskal–Wallis test with subsequent Dunn’s multiple comparisons, in panel c was determined by two-tailed Wilcoxon test, and in panel d was determined by two-tailed Mann–Whitney test. *, P ≤ 0.05; **, P ≤ 0.01; ****, P ≤ 0.0001; ns, not significant.

