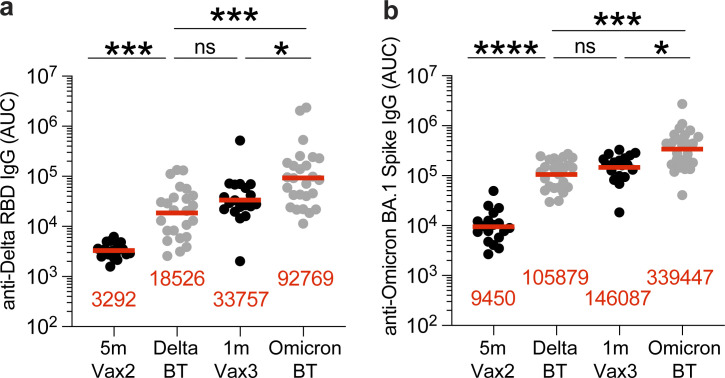
Figure S1.
Plasma ELISA. (a and b) Graph shows area under the curve (AUC) for plasma IgG binding to (a) SARS-CoV-2 Delta-RBD and (b) Omicron-Spike for vaccinated individuals after Vax2 (Cho et al., 2021), Delta breakthrough (Delta BT, n = 24), and vaccinated individuals after Vax3 (Muecksch et al., 2022) and Omicron breakthrough infection after Vax3 (Omicron BT, n = 26). All experiments were performed at least in duplicate and repeated twice. Red bars and values represent geometric mean values. Statistical significance in panels a and b was determined by two-tailed Kruskal–Wallis test with subsequent Dunn’s multiple comparisons. *, P ≤ 0.05; ***, P ≤ 0.001; ****, P ≤ 0.0001; ns, not significant.

