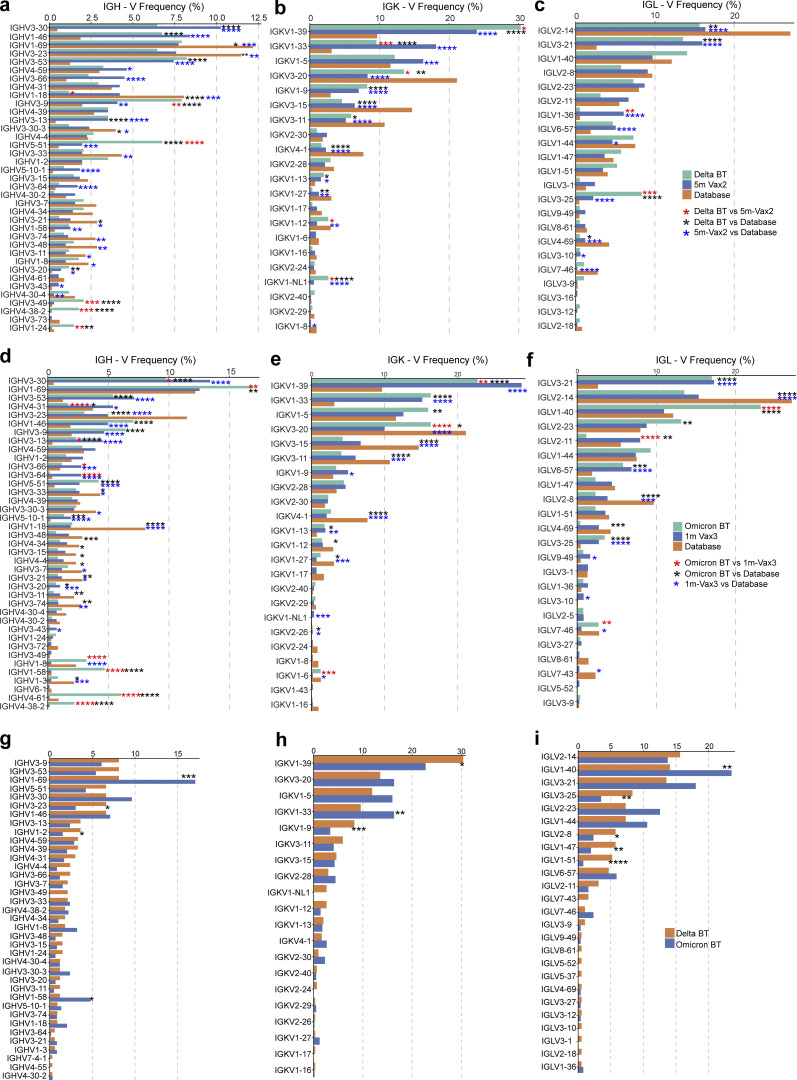
Figure S3.
Frequency distribution of human V genes. (a–c) Comparison of the frequency distribution of human V genes for heavy chain and light chains of anti-RBD antibodies from this study and from a database of shared clonotypes of human B cell receptor generated by Soto et al. (2019). Graph shows relative abundance of human IGHV (left panel), IGKV (middle panel), and IGLV (right panel) genes in Sequence Read Archive accession SRP010970 (orange), antibodies obtained from Delta breakthrough infection (green), and Vax2 (blue). (d–f) Same as panels a–c. Graph shows relative abundance of human IGHV (left panel), IGKV (middle panel), and IGLV (right panel) genes in Sequence Read Archive accession SRP010970 (orange), antibodies obtained from Omicron BA.1 breakthrough infection (green), and Vax3 (blue). (g–i) Graph shows relative abundance of human IGHV (left panel), IGKV (middle panel), and IGLV (right panel) genes of antibodies obtained from Delta breakthrough infection (orange) and from Omicron BA.1 breakthrough infection (blue). Statistical significance was determined by two-sided binomial test. *, P ≤ 0.05; **, P ≤ 0.01; ***, P ≤ 0.001; ****, P ≤ 0.0001.

