Figure S4.
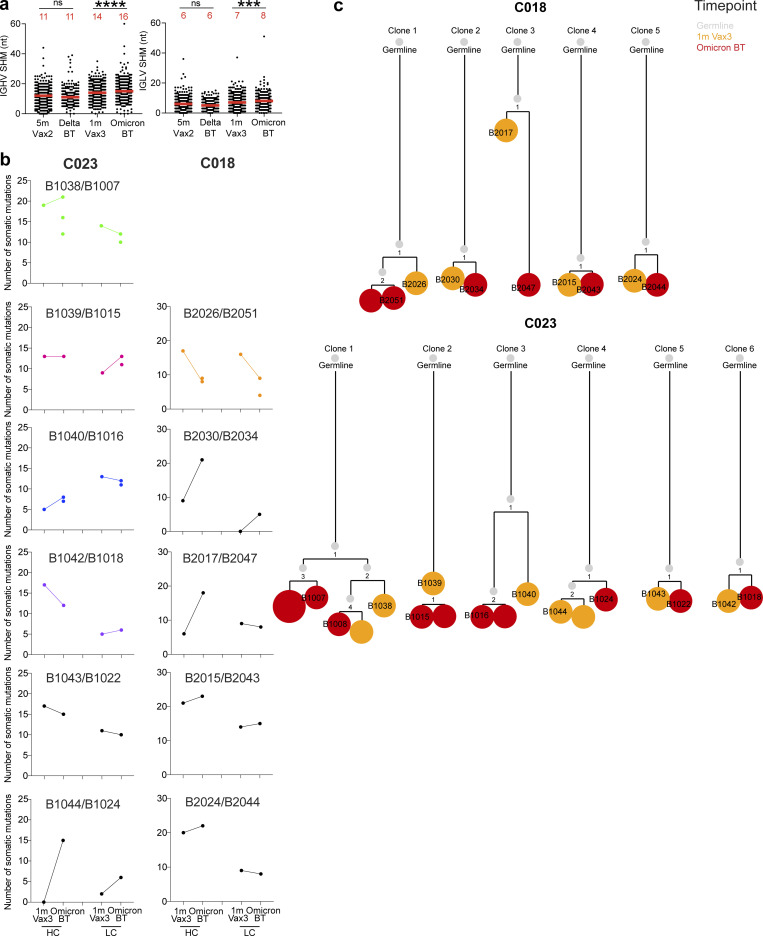
Antibody gene somatic hypermutations analysis and phylogenetic trees. (a) Number of nucleotide somatic hypermutations (SHM) in IGHV and IGLV in WT-RBD–specific sequences, separately after Delta or Omicron breakthrough infection, to Vax2 (Cho et al., 2021) and Vax3 (Muecksch et al., 2022). Red bars and numbers in panel a represent median value. (b) The number of somatic nucleotide mutations found in clonally related families found in 1 mo after Vax3 and following Omicron breakthrough infection from patients C018 and C023. Color of dot plots match the color of pie slices within the donut plot (Fig. 2 d), which indicate persisting clones. (c) The phylogenetic tree graph shows clones from C018 and C023, representing the clonal evolution of RBD-binding MBCs and derived antibodies obtained from the third mRNA vaccine and the following Omicron BA.1 breakthrough infection. ***, P ≤ 0.001; ****, P ≤ 0.0001; ns, not significant.

