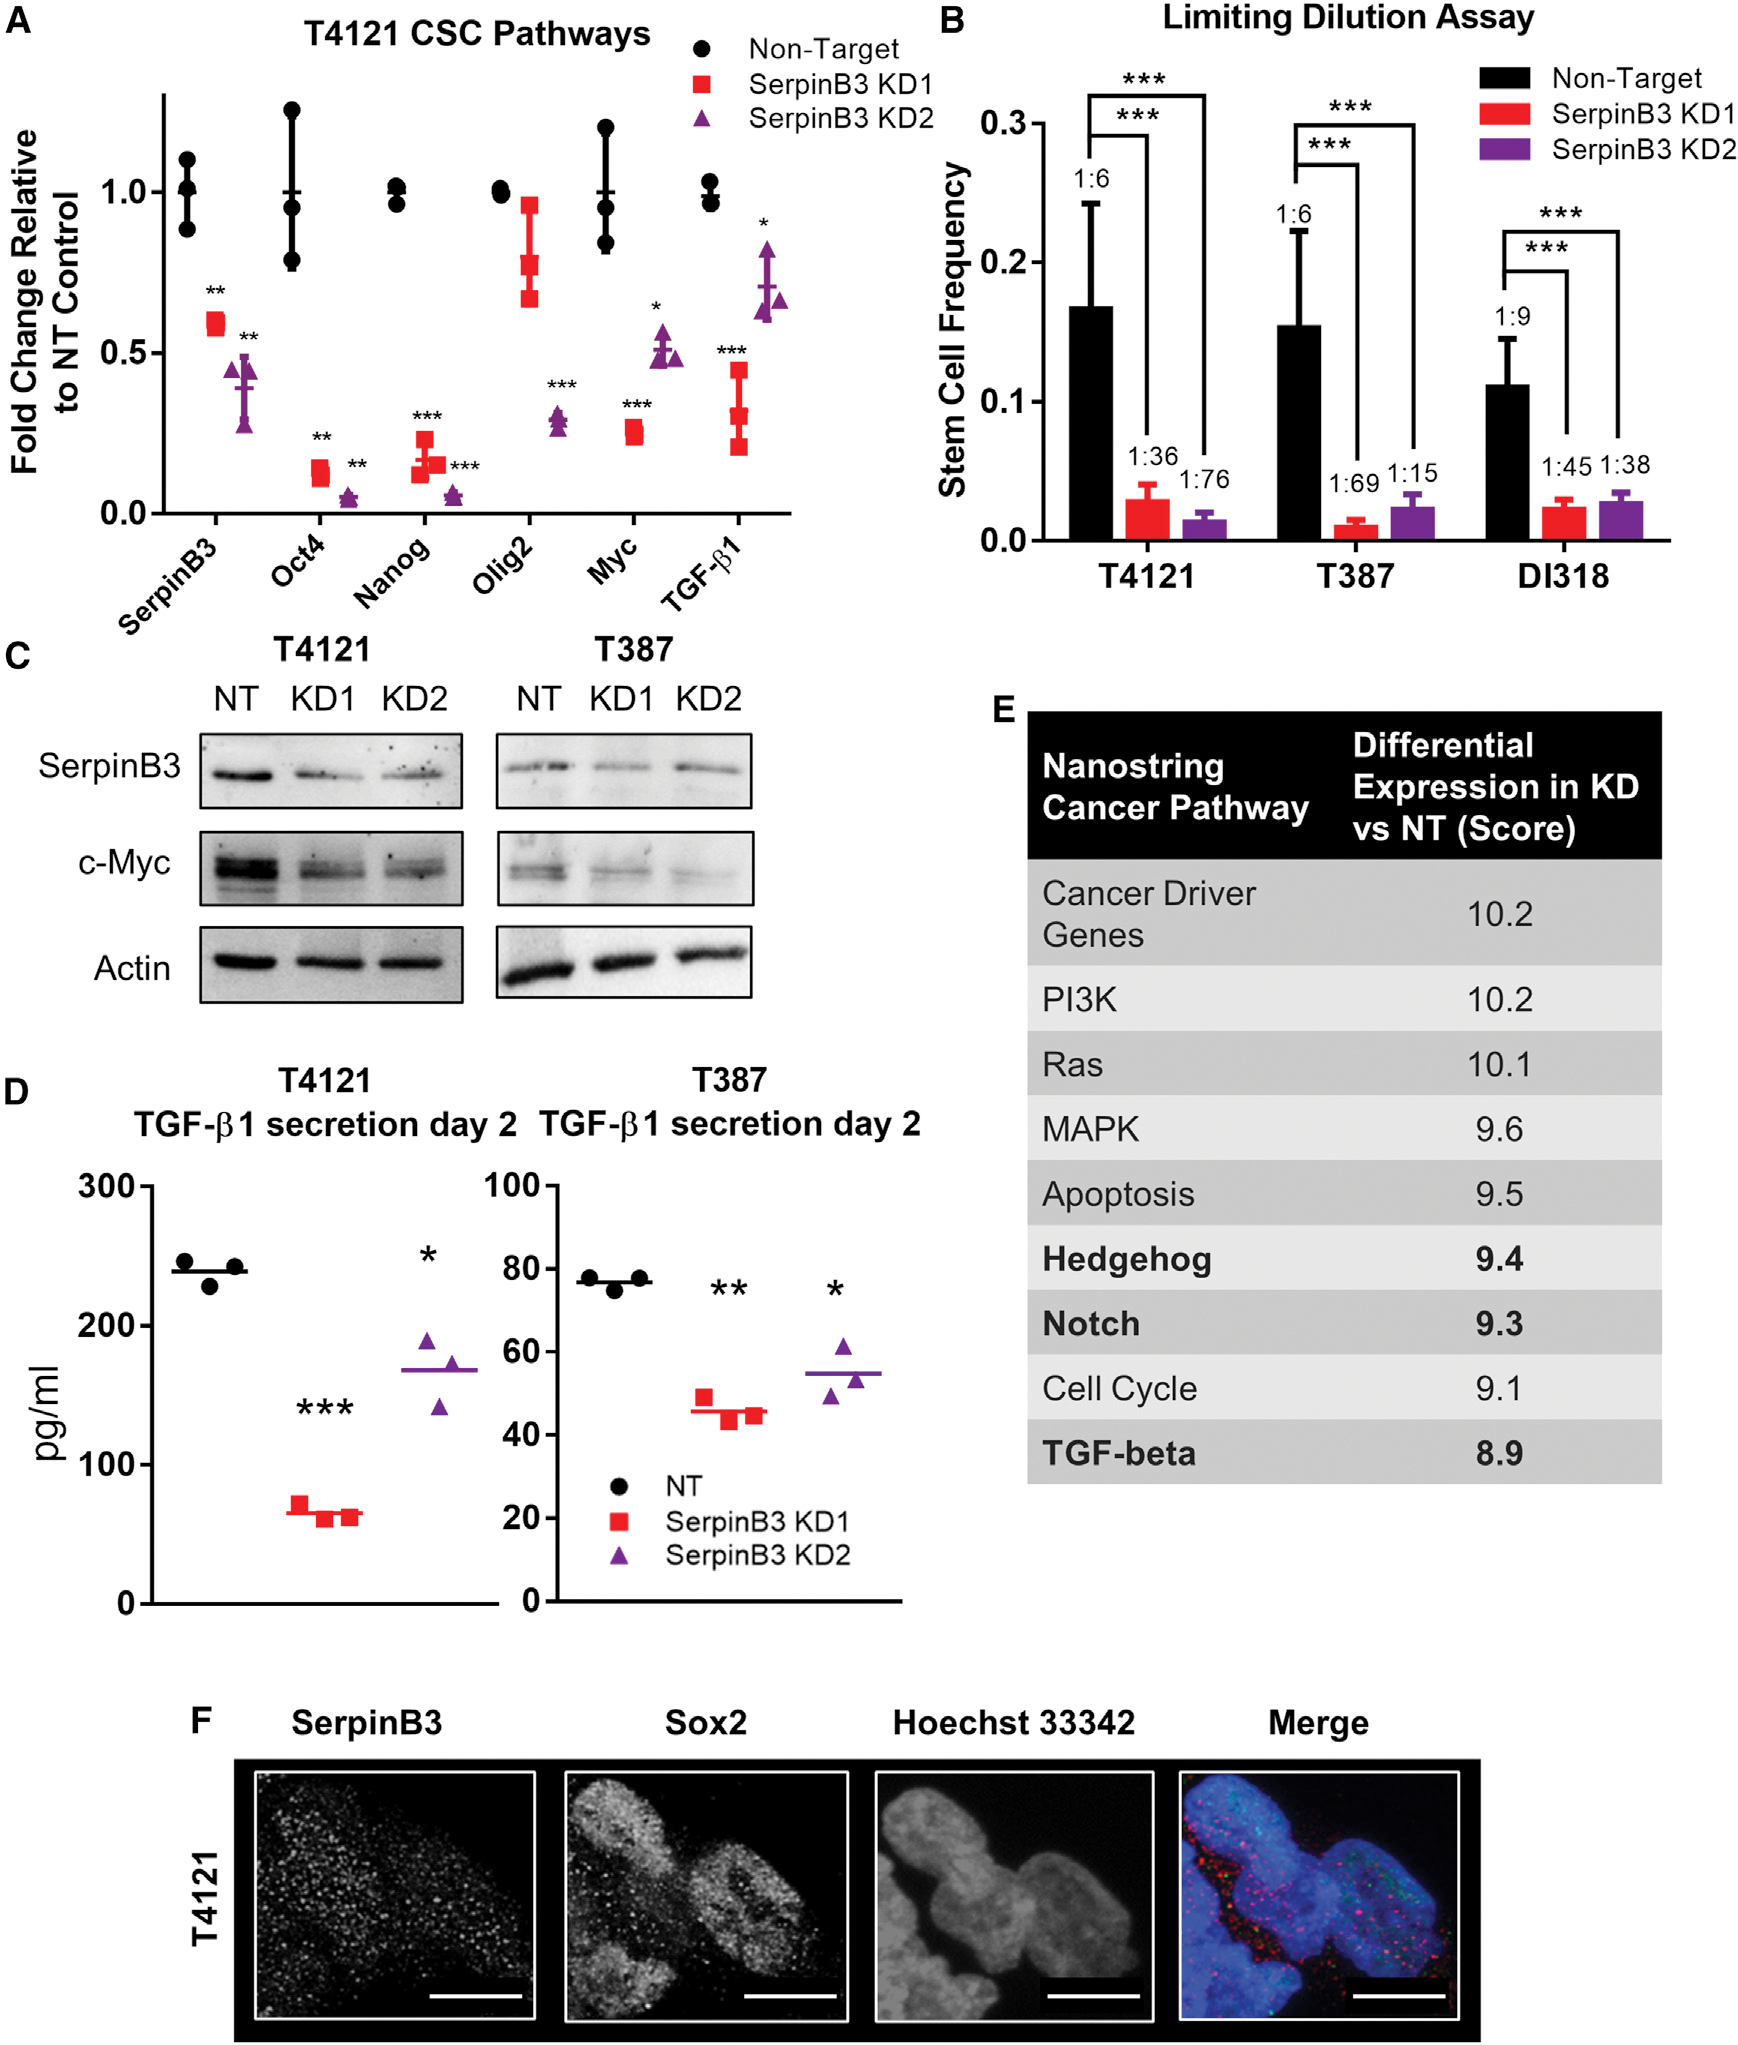
Figure 2. SerpinB3 regulates known CSC pathways.

(A) RNA was isolated after SerpinB3 knockdown in T4121 cells, and qPCR was performed for SERPINB3, OCT4, NANOG, OLIG2, MYC, and TGF-β1 (3 technical replicates).
(B) Tumor cells were plated in a limiting-dilution manner, and the number of wells containing spheres was counted after 14 days and used to calculate stem cell frequencies using the online algorithm detailed in the methods. N = 12 wells per dilution.
(C) c-MYC expression after SerpinB3 knockdown was assessed via western blot, with actin as a loading control.
(D) TGF-β1 secretion was analyzed 2 days after plating and normalized to total protein (3 technical replicates per condition, per tumor model).
(E) NanoString pathway score comparing SerpinB3 knockdown to non-target control. Bolded rows represent pathways known to regulate the CSC state.
(F) Immunofluorescence staining of T4121 CSCs for SerpinB3 and SOX2. Scale bar represents 10 μM.
p < 0.05 was considered statistically significant. *p < 0.05, **p < 0.01, ***p < 0.001, as determined by 1-way ANOVA with Dunnett’s multiple comparisons, Student’s t test for qPCR data, or chi-squared p value for limiting dilution assay. Error bars represent standard deviations.
