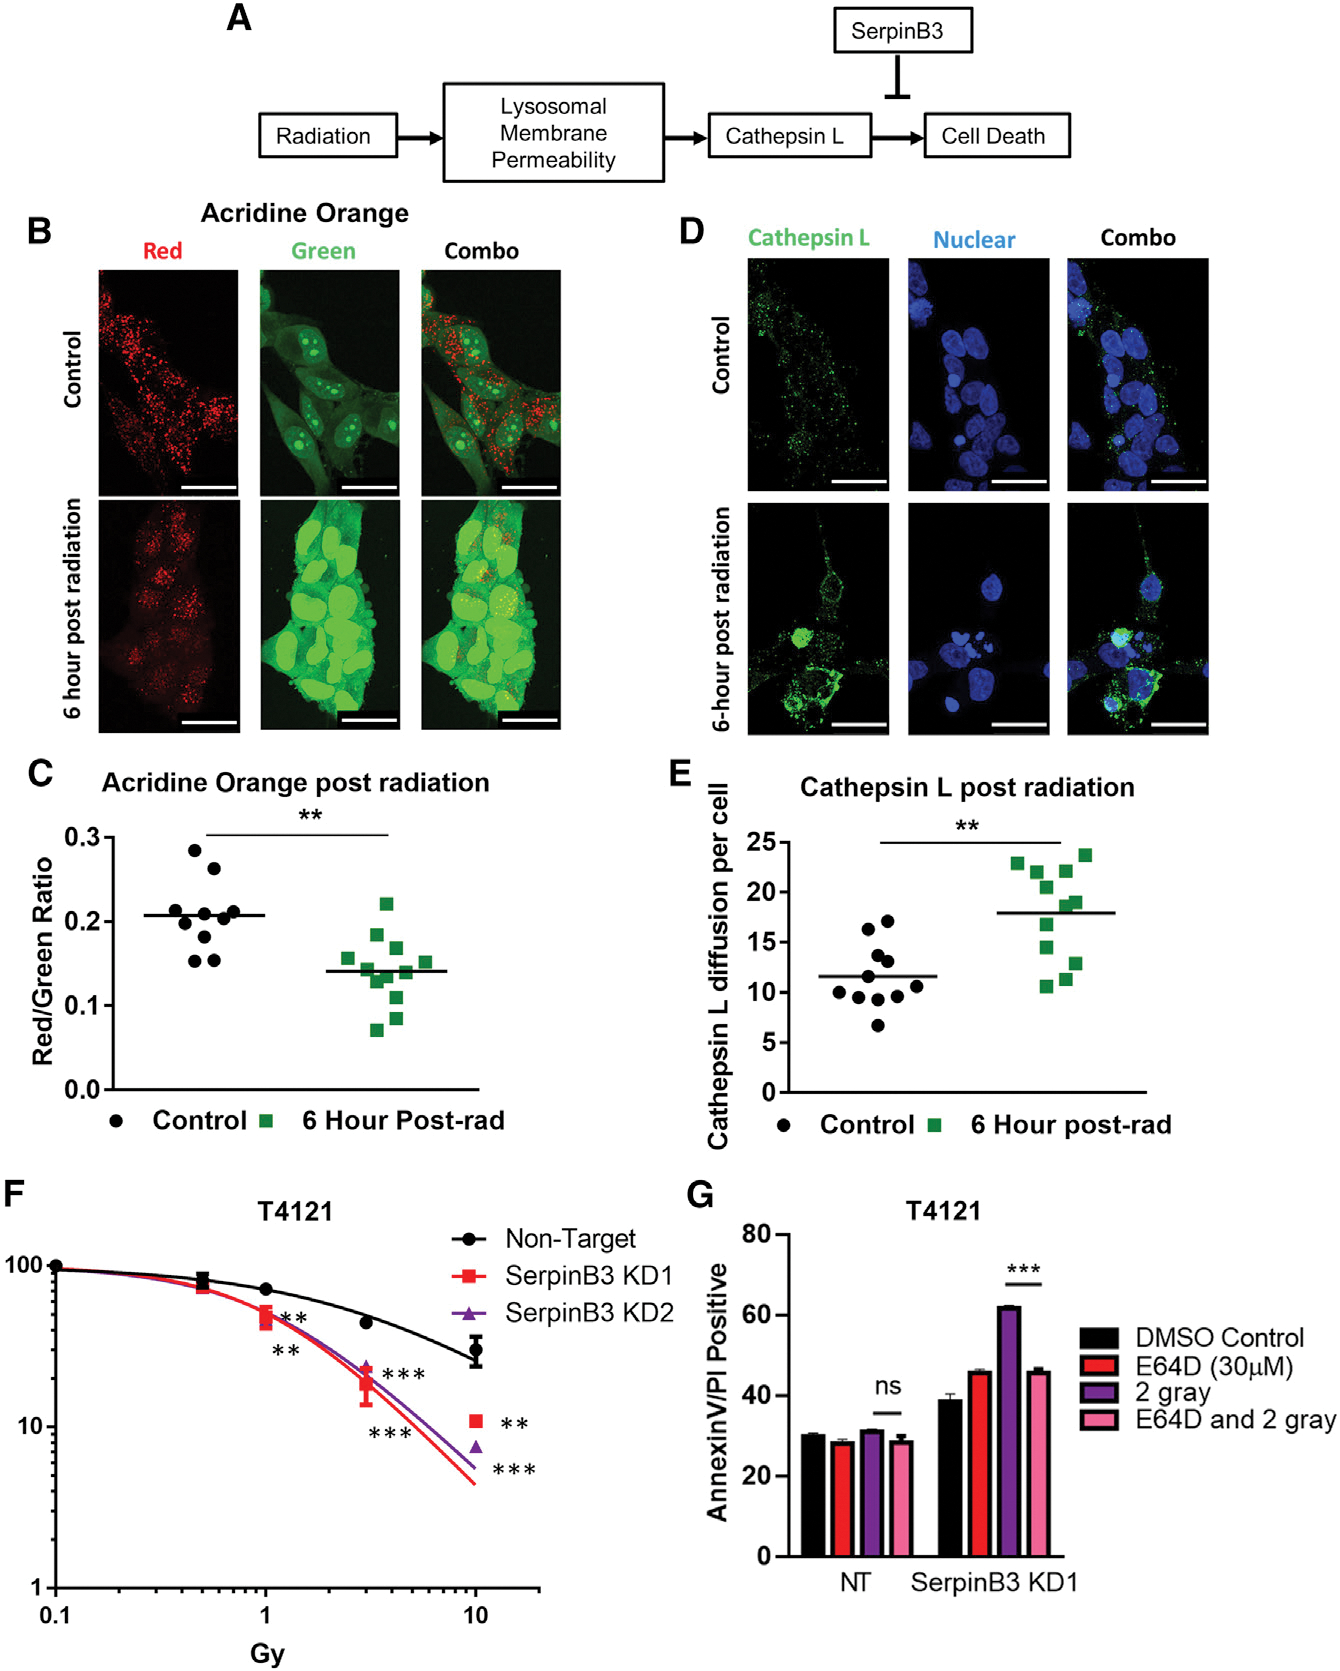
Figure 4. SerpinB3 buffers cells from lysosomal membrane permeability.

(A) Schematic of lysosomal-mediated cell death after radiation.
(B and C) Acridine orange was added to cells 6 h after irradiation with 5 Gy, and images from 12 random visual fields were taken. The red:green ratio per image was calculated comparing control to irradiated conditions. Scale bar represents 25 μM.
(D and E) Six hours post-irradiation, cells were fixed with paraformaldehyde and stained for cathepsin L. The integrated density of cathepsin L per cell was determined and compared between the radiation and control conditions (12 images per condition). Scale bar, 25 μM.
(F) Cell viability was measured after 2 days of varying doses of radiation, and the percentage of viable cells is shown compared to each group’s untreated control at each dose of radiation (3 technical replicates per condition).
(G) T4121 tumor cells were treated with 2 Gy radiation with or without 30 μM E64D. Twenty-four hours post-radiation, annexin V+/PI+ cells were quantified, n = 3 per condition.
p < 0.05 was considered statistically significant. *p < 0.05, **p < 0.01, ***p < 0.001, as determined by 1-way ANOVA with Dunnett’s multiple comparisons (F) or Student’s t test (C, E, and G). Error bars, standard deviations.
