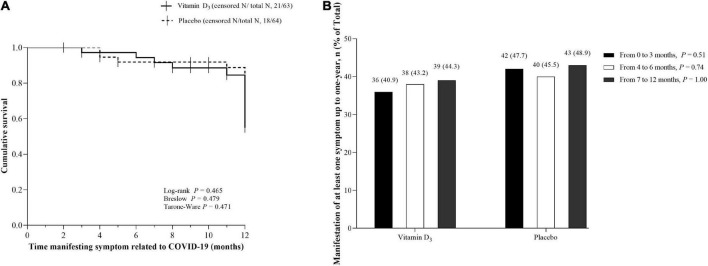
FIGURE 2.
Kaplan-Meier curves for time manifesting symptoms and frequency of participants manifesting at least one symptom up to 1 year. (A) Cumulative survival for time (months) manifesting symptoms related to COVID-19 after hospital discharge in the vitamin D3 (42/63) and placebo groups (46/64). Vertical bars present single censored events (stop manifesting the symptom) in the vitamin D3 (n = 21) and placebo (n = 18) groups. (B) Frequency of participants manifesting at least one symptom from hospital discharge to 1-year follow-up. Values are n (% within the group). Proportions were compared between groups using chi-square tests (χ2). In panels A and B, data were missing for 11.8% of patients (n = 9 in the placebo group and n = 8 in the vitamin D3 group) due to lack of contact during follow-up, representing 127 patients in total.

