Figure 5.
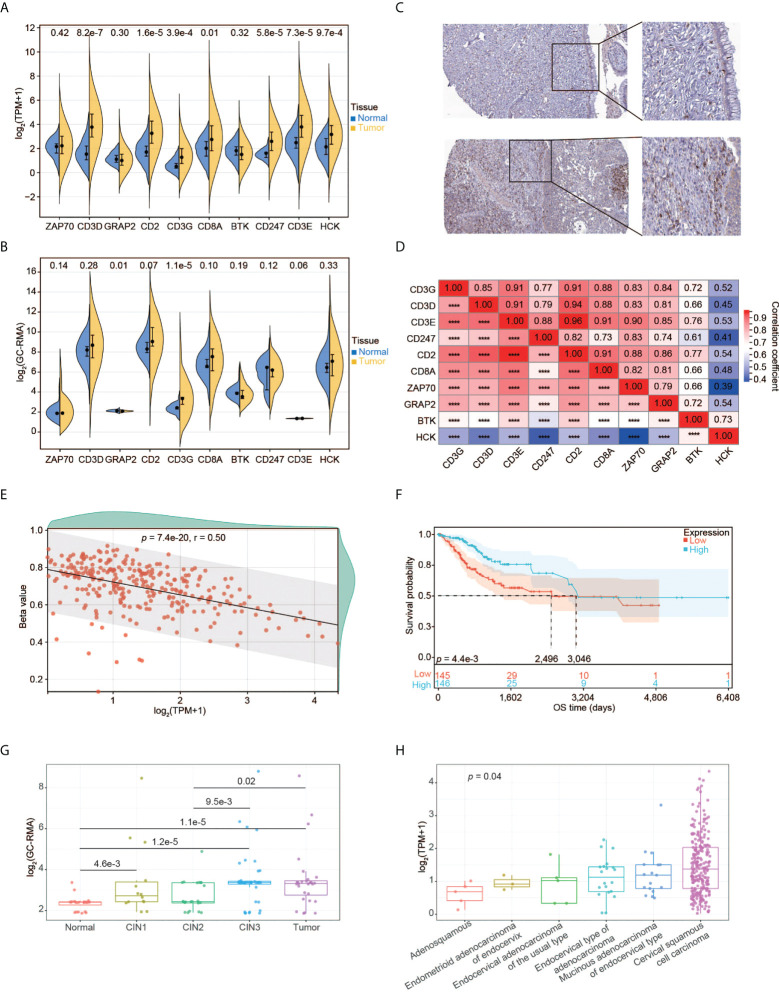
Expression pattern of CD3G as the key gene in CESC. (A) The expression profiles of the 10 key genes in normal tissues and tumors. (B) The expression profiles of the 10 key genes validated using GSE63514. (C) CD3G protein expression based on Immunohistochemistry data from the HPA database. Up panel: normal tissue. Down panel: CESC tissue. Antibody: HPA038494. The patient id of the normal cervix tissue is 1773. It has no detectable score of antibody staining. The patient id of the tumor tissue is 1751. It has medium staining, moderate intensity, and 75%-25% quantity score. (D) The co-expression of the 10 key genes in CESC. ****p < 0.0001. (E) The methylation pattern of CD3G in CESC. (F) OS analysis of high and low CD3G expression for TCGA-CESC patients. (G) The association of CD3G expression with CIN lesion. (H) The association of CD3G expression with histological types.

