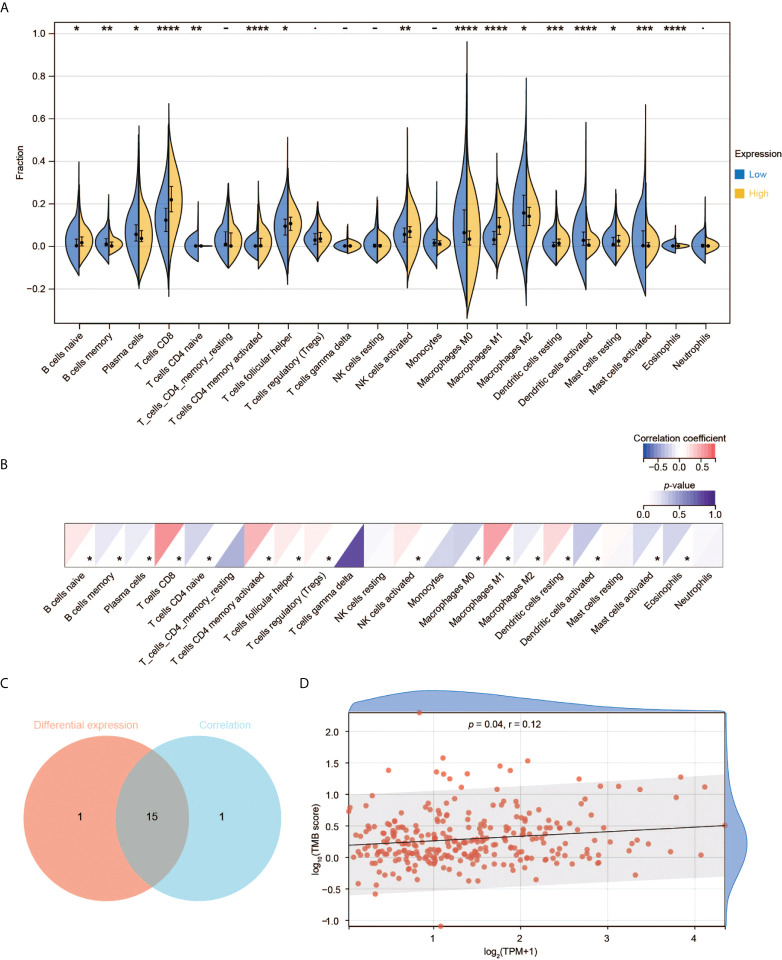
Figure 7.
Immune cell infiltration analysis of CD3G. (A) The difference of TIC proportions with high or low CD3G expression in CESC. (B) The correlation of the TICs and CD3G expression. *p < 0.05, **p < 0.01, ***p < 0.001, ****p < 0.0001. (C) The shared TICs between the analyses in (A, B). (D) The correlation of TMB and CD3G expression.

