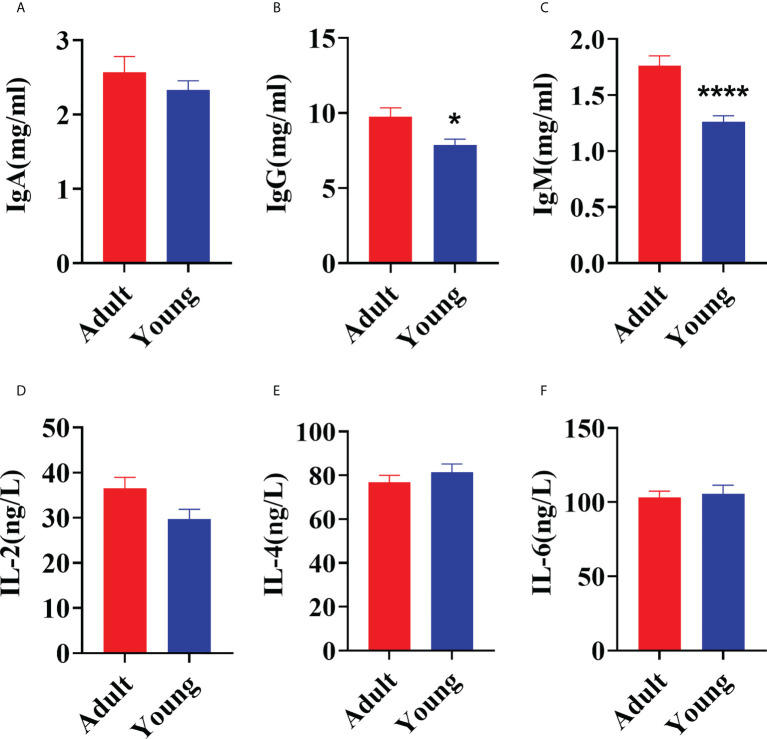
Figure 1.
Comparison of serum immune factors concentrations between young (30 ± 2 d) and adult (2 yrs old) goats. (A) The concentration of IgA. (B) The concentration of IgG. (C) The concentration of IgM. (D) The concentration of IL-2. (E) The concentration of IL-4. (F) The concentration of IL-6. The data were analyzed with unpaired t tests, and the data were expressed as mean ± SEM. *P < 0.05 was statistically significance. ****P < 0.0001 was the extremely significance.

