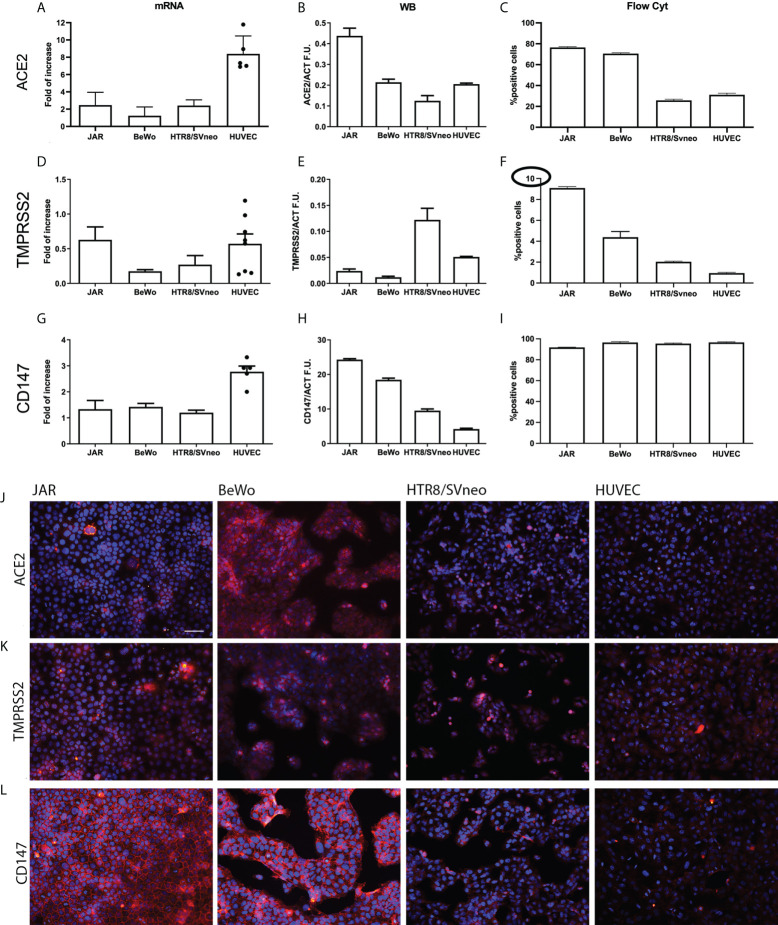
Figure 2.
Characterization of SARS-CoV-2 entry receptors’ expression in placental cell lines. Gene and protein expression levels of ACE2 (A-C), TMPRSS2 (D-F) and CD147 (G-I) were evaluated by RT-qPCR, Western blot and flow cytometry in JAR, BeWo, HTR8/SVneo and HUVECs (n = 6, different populations are represented by dots). All the placental cell lines showed a low level protein expression of TMPRSS2 (highlighted by the circle in the different set up of the axis) and a high protein expression level of CD147, whilst ACE2 expression appeared more variable among them. (J-L) Immunofluorescence analysis of SARS-CoV-2 entry receptors in placental cell lines. JAR, BeWo, HTR8/SVneo and HUVECs were stained with anti-human ACE2 (J), TMPRSS2 (K) or CD147 (L) primary antibodies, followed by Cy3-conjugated secondary antibodies (red). Nuclei were stained in blue with DAPI. Images were acquired with a Leica DM 3000 fluorescence microscope using a Leica DFC 7000 camera. Scale bar, 50 μm.

