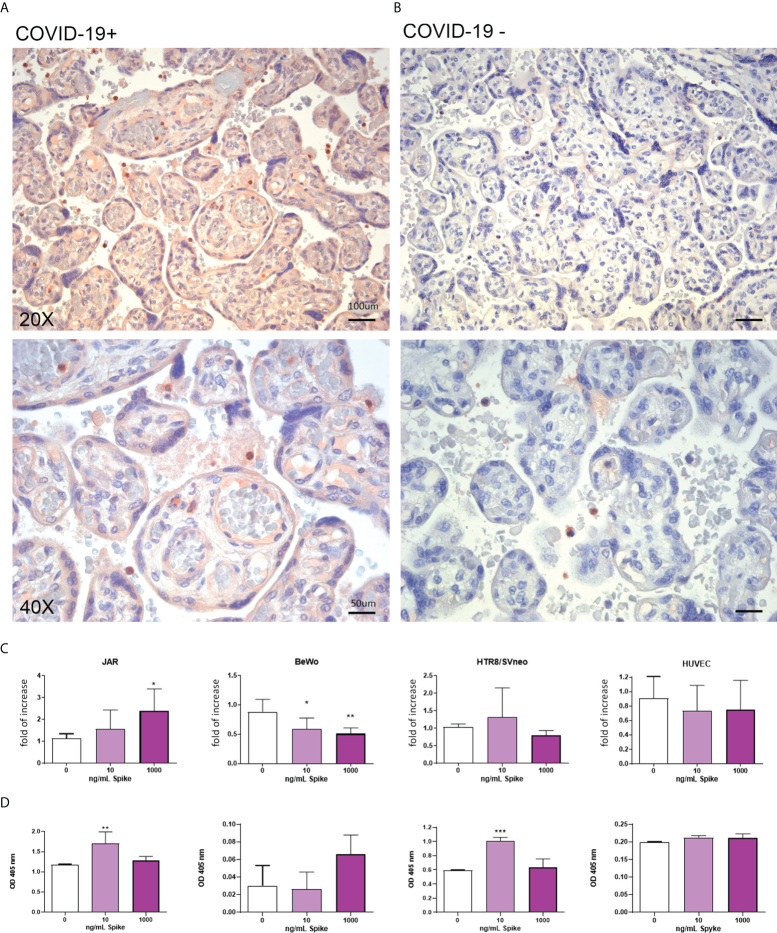
Figure 4.
(A, B) Representative microphotographs showing the expression of TMPRSS2 in COVID-19+ (A) or COVID-19- (B) placental tissues. Streptavidin–biotin–peroxidase complex system with AEC (red) chromogen. (C) After stimulation with 10 ng/mL or 1000 ng/mL of Spike S1 protein for 24 h, RNA was extracted from placental cell lines and quantified for TMPRSS2 expression by RT-qPCR. The expression was normalized against the housekeeping genes 18S, ACTB and GAPDH; results were mediated (geometric mean) and expressed as fold increase. Data are expressed as mean ± SE of three independent experiments performed in triplicate. *p < 0.05; **p < 0.01, ***p < 0.001, as compared to untreated cells (Mann-Whitney test). (D) ELISA on whole cells for detecting TMPRSS2 surface expression following 24 h of incubation with 10 ng/mL or 1000 ng/mL of Spike S1 protein. Data are expressed as mean ± SD of two independent experiments performed in triplicate. *p < 0.05, ***p < 0.001 with respect to untreated cells (Mann-Whitney test).

