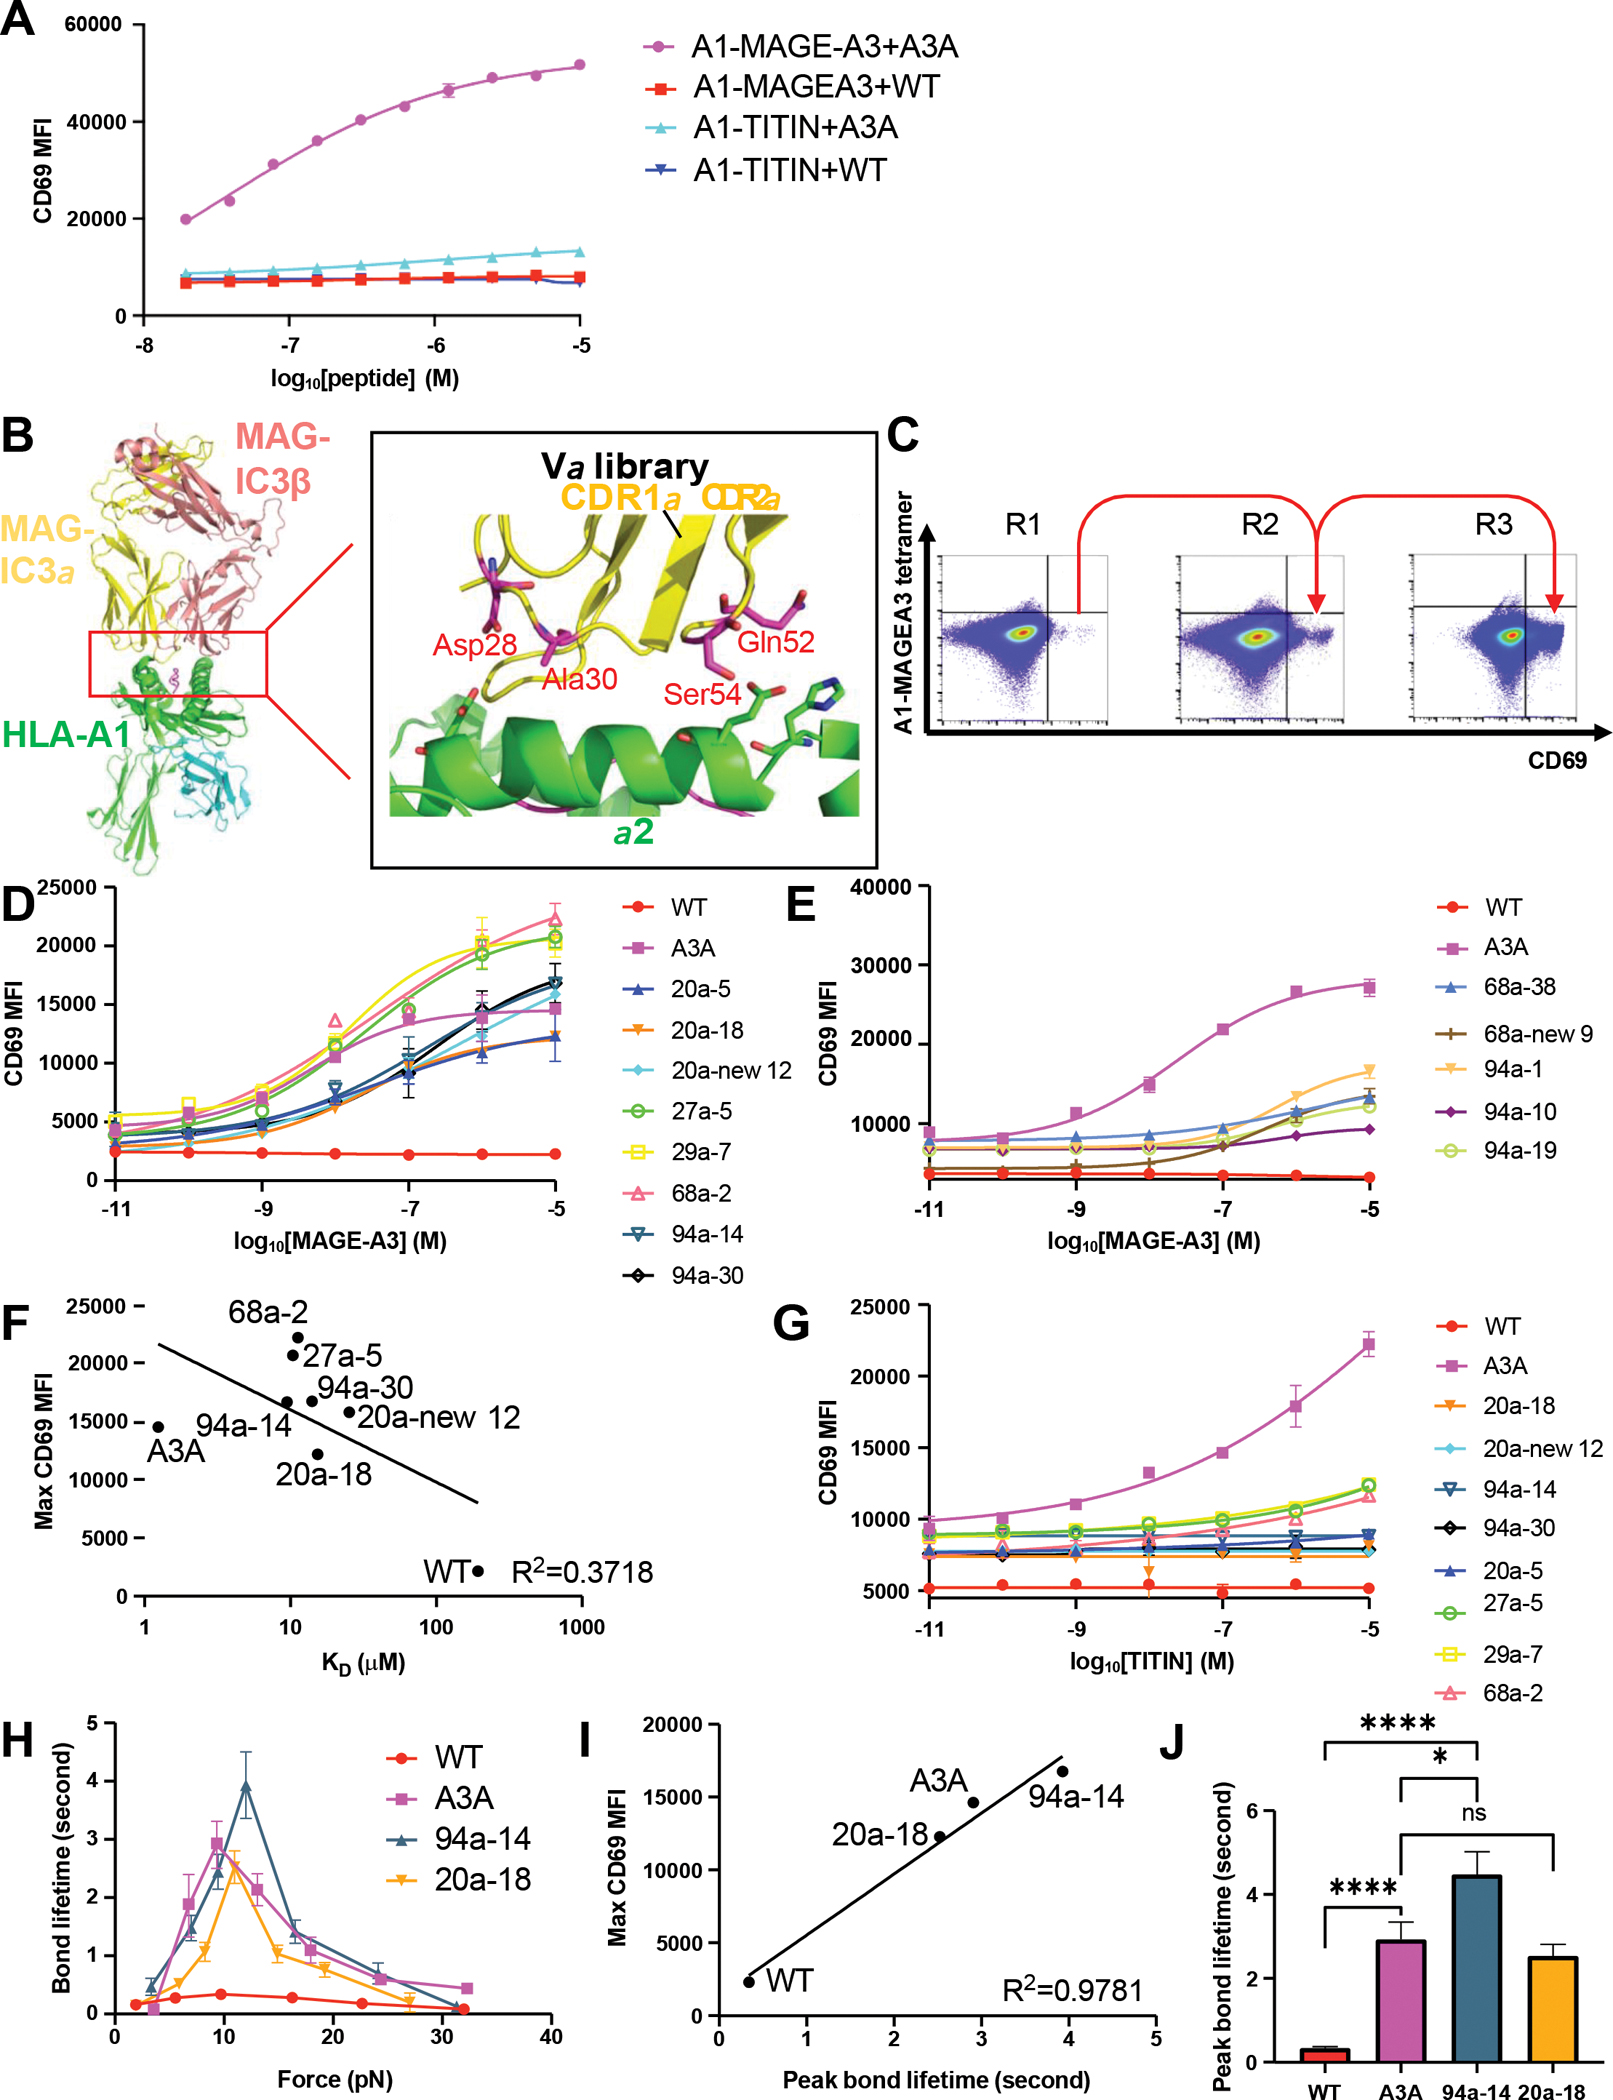
Figure 4. Catch bond engineering of MAGE-A3-specific TCR.

(A) The WT TCR or A3A TCR chains were transduced in SKW3 T cells. The transfectants were stimulated by HLA-A1+ 293T cells pulsed with titrated MAGE-A3 peptide or TITIN peptide. Anti-CD69 staining was performed on the T cells and analyzed by flow cytometry.
(B) The design of MAGE-A3 TCR Vα library. The library has 4 residues picked to be randomized. The side chains of the selected resides on the TCR were shown as sticks in the figures.
(C) 3 rounds of selection of the MAGE-A3 TCR Vα library on tetramer staining-low and anti-CD69 staining-high gate. The gate is based on the staining of MAGE-A3 WT TCR.
(D) The 8 high-potency MAGE-A3 TCR mutants were transduced into SKW3 T cells. The transfectants were stimulated by HLA-A1+ 293T cells pulsed with titrated MAGE-A3 peptide. Anti-CD69 staining was performed on the T cells and analyzed by flow cytometry.
(E) The 5 intermediate-potency MAGE-A3 TCR mutants were transduced into SKW3 T cells. The transfectants were stimulated by HLA-A1+ 293T cells pulsed with titrated MAGE-A3 peptide. Anti-CD69 staining was performed on the T cells and analyzed by flow cytometry.
(F) The correlation between mean value of maximal anti-CD69 MFI and 3D affinity of selected MAGE-A3 TCR mutants binding to HLA-A1-MAGE-A3.
(G) The 8 high-potency MAGE-A3 TCR mutants were transduced in SKW3 T cells. The transfectants were stimulated by HLA-A1+ 293T cells pulsed with titrated TITIN peptide. Anti-CD69 staining was performed on the T cells and analyzed by flow cytometry.
(H) Biomembrane force probe experiments to measure bond lifetime force curves for WT, A3A, 94a-14 or 20a-18 TCR binding to HLA-A1-MAGE-A3. Data are shown as mean ± SEM of 500+ individual bond lifetimes per force curve.
(I) Mean value of maximal anti-CD69 MFI versus peak bond lifetime of MAGE-A3 TCR mutants transfectants.
(J) Multiple measurements of bond lifetime at 10 pN for WT, A3A, 94a-14 and 20a-18 TCR. ns: not significant; ✱: P<0.05; ✱✱: P<0.01; ✱✱✱: P<0.001; ✱✱✱✱: P<0.0001
(A, D-E, G) Data are representative of 3 independent experiments. Data are shown as mean ± SD of technical triplicates.
