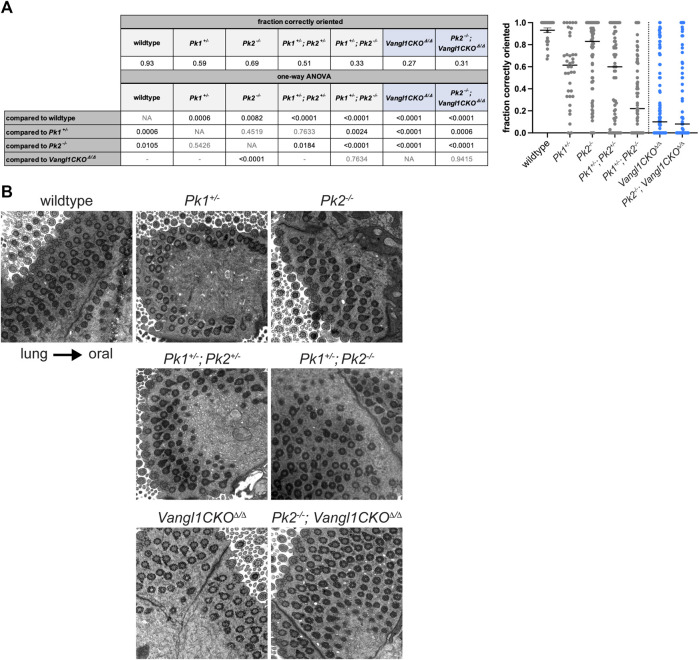
FIGURE 3.
Basal body orientation in adult Pk mutant multiciliated cells. (A). Basal body misorientation metrics in adult Pk mutants with appropriate statistics. Vangl1CKO Δ/Δ and Pk2 −/− data were used from (Vladar et al., 2016) with permission. Fraction of correctly oriented basal feet per cell is plotted in the graph (right). Results from a one-way ANOVA are shown in the table (left) as follows: statistically significant p-values are shown in black, nonsignificant p-values are shown in grey, grey "-” indicates tests that are not shown. Vangl1CKO Δ/Δ containing genotypes are highlighted in blue. (B). Representative TEM images showing basal foot orientation with respect to tissue axis.

