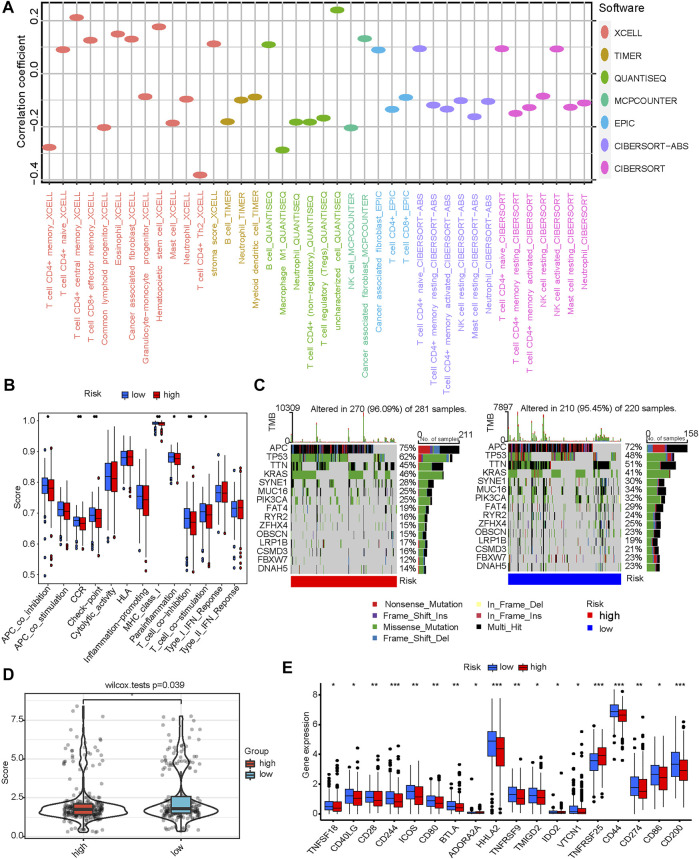
FIGURE 5.
Correlation between CRG-Score groups and immunity. (A) Correlation between CRG-Score groups and immune infiltration status. (B) Correlation between CRG-Score groups and immune-related pathway activity. (C) Oncoplot represents the top 15 mutated genes between CRG-Score groups. (D) Tumor mutational burden (TMB) between CRG-Score groups. (E) Correlation between CRG-Score groups and expression levels of immune checkpoint-related genes. *p < 0.05, **p < 0.01, ***p < 0.001.

