Figure 1.

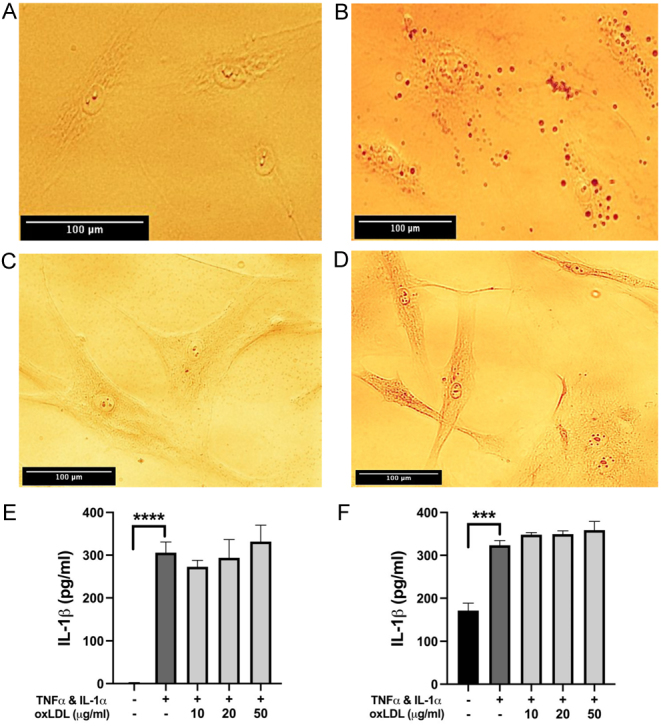
(A, B, C and D) Representative bright-field microscope images of stimulated, untreated HCAECs (A) and HCASMCs (C) compared with cytokine-stimulated (10 ng/mL of TNF-α and IL-1α for 48 h) HCAECs (B) and HCASMCs (D) treated with 50 µg/mL oxLDL for 6 h (HCAECs) or 2h (HCASMCs) and stained with Oil red O. Droplets stained with Oil red O were observed within both cell types upon stimulation and treatment. Images were taken using a Leica© bright-field microscope and are representative of 3 independent experiments, scale bar = 100 µm. (E and F) ELISA analysis of intracellular IL-1β in HCAECs (E) and HCASMCs (F) showed a significant increase following cytokine priming but no effect with oxLDL treatment when compared to the cytokine-only control. Data are presented as mean ± s.e.m. and analysed using a one-way ANOVA followed by a Bonferroni post-hoc test, ****P < 0.0001, ***P < 0.001, n = 3 independent donors.

 This work is licensed under a