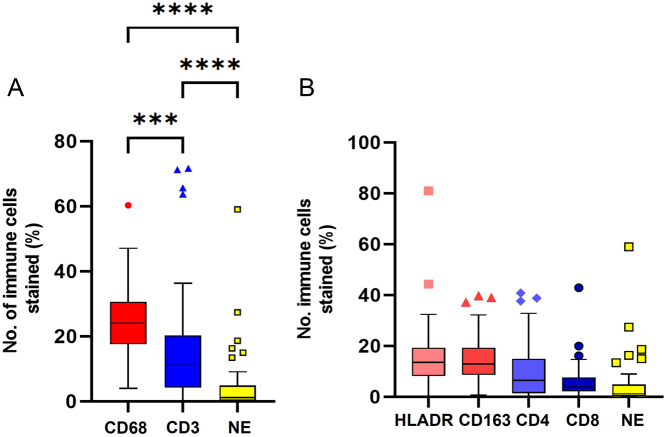
Figure 2.
Immunohistochemical analysis of immune cells in PPGL tumours. Immune cells analysed: macrophages (CD68+, M1 HLADR+, M2 CD163+), lymphocytes (CD3+, Th CD4+, Tc CD8+) and neutrophils (NE, neutrophil elastase+). Box-and-whisker plots of mean, IQR and outlying points of the percentage of immunopositive cells as a proportion of the total number of cells for PPGL tumour tissue (n = 65). (A) Comparison between major immune cell types. Statistical analysis by ANOVA with Tukey’s multi-comparison tests (P < 0.001). Macrophages vs lymphocytes (P = 0.0002), macrophages vs neutrophils (P < 0.001), lymphocyte vs neutrophils (P < 0.001). (B) Subsets of macrophages (HLADR+, CD163+) and lymphocytes (CD4+, CD8+). ANOVA with Tukey’s multi-comparison tests (P < 0.001). Th, T-cell helper lymphocyte, Tc, T-cell cytotoxic lymphocytes. A full colour version of this figure is available at https://doi.org/10.1530/ERC-22-0020.

 This work is licensed under a