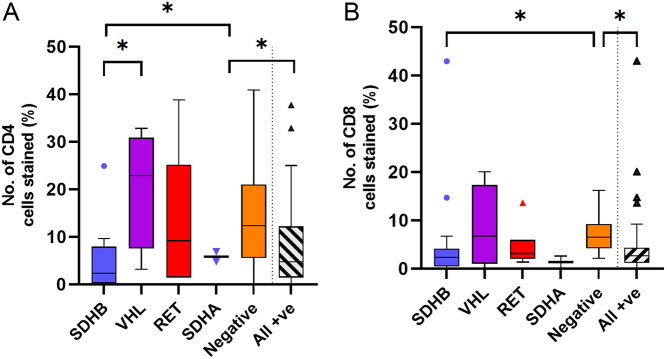
Figure 5.
Immunohistochemical analysis of immune cells in PPGL tumours divided into genetic groups. Immune cells analysed: macrophages (CD68+), lymphocytes (CD3+), neutrophils (NE, neutrophil elastase+), M2:M1 (CD163+:HLADR+) and T-helper lymphocytes:Cytotoxic T cells (Tc:Th, CD4+:CD8+). (A) Box-and-whisker plot of mean, IQR and outlying points of the percentage of immunopositive cells as a proportion of the total number of cells for the different underlying genetic mutations for number of T-helper lymphocytes (CD4+). Statistical analysis by Kruskal–-allis test with Dunn’s multiple comparison tests (P = 0.0315*), SDHB vs VHL (P = 0.0211*), SDHB vs negative (P = 0.0427*), all positive vs negative (P = 0.027*). (B) Box-and-whisker plot of mean, IQR and outlying points of the percentage of immunopositive cells as a proportion of the total number of cells for the different underlying genetic mutations for number of cytotoxic T lymphocytes (CD8+). Statistical analysis by Kruskal–Wallis test with Dunn’s multiple comparison tests (P = 0.0185), SDHB vs negative (P = 0.033*), all positive vs negative (P = 0.00473*). A full colour version of this figure is available at https://doi.org/10.1530/ERC-22-0020.

 This work is licensed under a