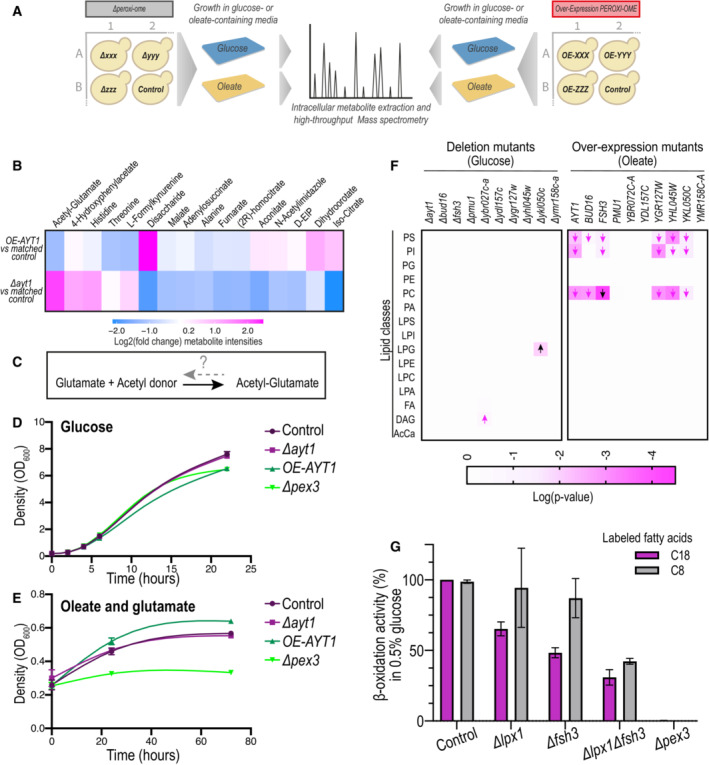
Figure 4. Systematic metabolomic analyses of peroxi‐ome mutants provide clues for new enzymatic functions in peroxisomes.

- Large‐scale metabolomic analysis of peroxi‐ome mutants (either overexpression or deletion of each gene) was performed in both glucose and oleate‐containing medium to uncover uncharted metabolic functions for peroxisomal proteins in an unbiased manner. Raw data is in Datasets EV4 and EV5, circular dendrograms of all conditions are in Appendix Fig S6.
- Metabolomic analysis focused on strains with overexpression or deletion of the AYT1 gene shows a significant reduction or accumulation, respectively, in acetyl‐glutamate compared to the matched control strain of each mutant. Only metabolites changing significantly in at least one of the two conditions are presented. D‐EIP is D‐erythro‐1‐(Imidazole‐4‐yl) glycerol 3‐phosphate.
- Acetyl‐glutamate can be generated either spontaneously in high concentrations of acetyl‐CoA and glutamate, or by Arg2 or Arg7. However, it is not known how it is catabolized.
- A growth assay in a condition that does not induce high levels of acetyl‐CoA in peroxisomes (glucose) shows that all strains grow similarly to the control until the stationary phase when peroxisomes become vital. In the stationary phase, the overexpression (OE) of AYT1 grows to a lower density than the control strain, plausibly due to burdening of peroxisomal functions.
- A growth assay in a condition expected to elevate acetyl‐glutamate levels in peroxisomes (oleate as a sole carbon source and glutamate as a nitrogen source) demonstrates that the AYT1 overexpressing strain grows faster and to a higher density than the control.
- Lipidomic analysis on mutants of 10 newly identified peroxisomal proteins whose molecular function in the yeast cell is putative or unknown shows that cells overexpressing FSH3 had the most significant change in all conditions compared to the control strain, with a reduction of PC (raw data is in Dataset EV7). Δykl050c shows the most significant change in glucose conditions, with an increase of LPG lipids. Additional conditions are represented in Appendix Fig S7A. Arrows indicate the directionality of the fold‐change. Black arrows are the most significant changes in each condition. PS, phosphatidylserine; PI, phosphatidylinositol; PG, phosphatidylglycerol; PE, phosphatidylethanolamine; PC, phosphatidylcholine; PA, phosphatidic acid; “L” indicates a “lyso” phospholipid; FA, fatty acid; DAG, diacylglycerol; AcCa, acyl‐carnitine.
- A β‐oxidation activity assay of Δlpx1, Δfsh3, and Δlpx1Δfsh3 strains supplemented with labeled 8 carbon‐ or 18 carbon‐free fatty acids in media supplemented with 0.5% glucose shows a significant reduction in β‐oxidation activity compared to the control strain and the two single mutants, suggesting an overlapping role for Fsh3 with Lpx1. This assay was done in three biologically independent replicates. Bars represent the mean and error bars represent the standard deviation.
Data information: The growth assays in (D and E) were done in three biologically independent replicates and error bars were plotted. Note that some error bars are shorter than the symbol, hence are not visible in the graph.
