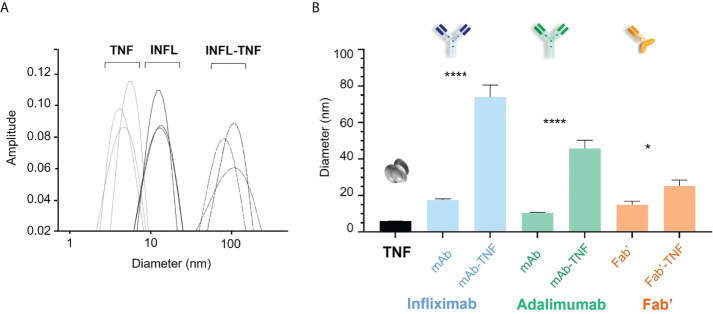
Figure 2.
Size characterization of TNF antagonists and immune complexes of TNF with antagonists by dynamic light scattering (DLS). (A) Representative hydrodynamic diameter profile of TNF, INFL and INFL-TNF as measured by DLS. Each line denotes one of three technical replicates for each condition, which were then ran in fourteen independent experiments, i.e., one for each donor. (B) Size comparison of TNF (black), TNF antagonists and their complexes with TNF; INFL and INFL-TNF (blue), ADAL and ADAL-TNF (green) and Fab’ and Fab'-TNF (orange), where each bar correspond to the mean and the standard error of mean (SEM) from fourteen independent experiments (n=14, ****p < 0.0001, *p < 0.05).

