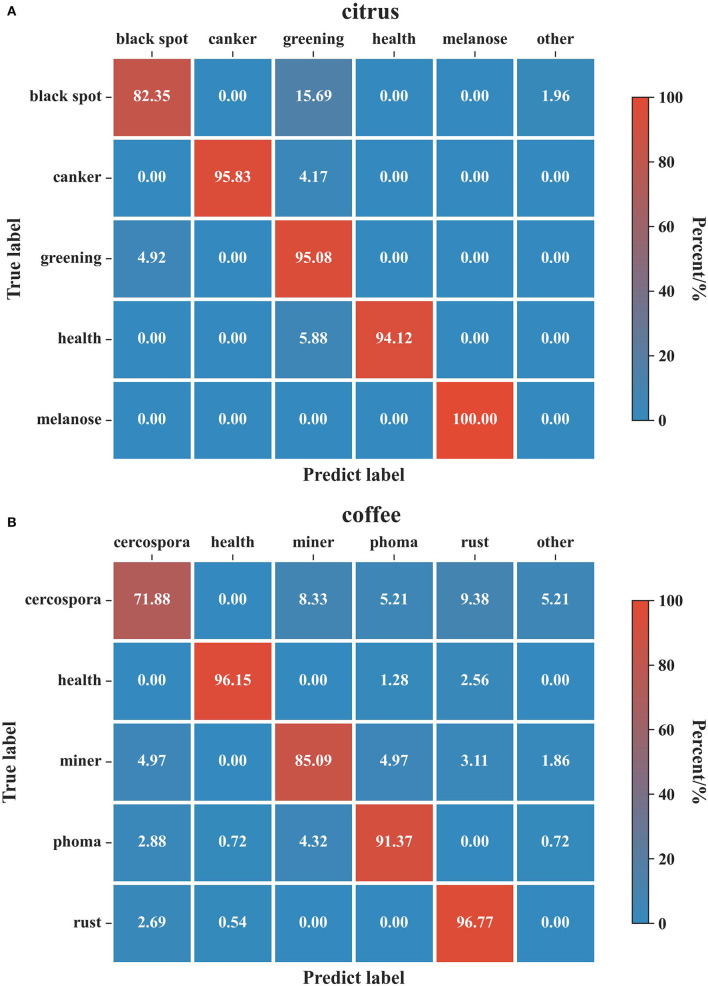
Figure 9.
Confusion matrix for the evaluation results on the citrus and coffee datasets. (A) Citrus dataset. (B) Coffee dataset. The columns of the confusion matrix indicate the predicted classes and the rows correspond to the true classes. The diagonal represents the ratio of true positives whereas the rest of the matrix corresponds to false negatives. A detection result whose probability is less than the threshold is set as the class: ‘other'.

