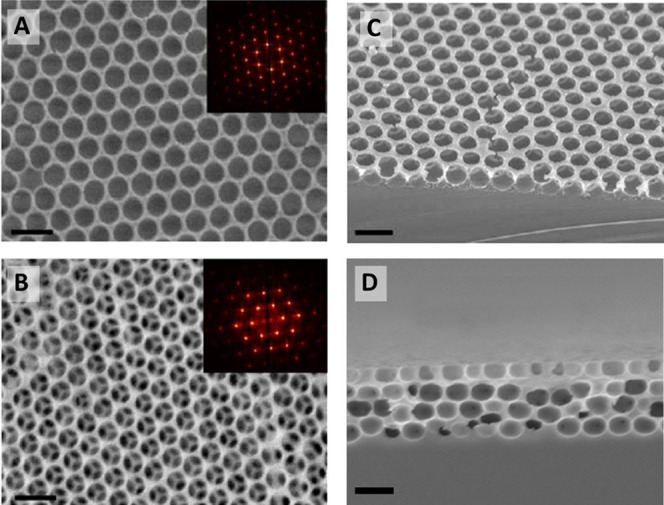
Figure 3.

Top-view SEM micrographs of (A) inverse opal monolayer (scale bar: 400 nm) and (B) inverse opal multilayer (scale bars: 1 μm). Insets: FFT of respective SEM image. Cross-section SEM images of (C) monolayer and (D) multilayer IO architectures.
