
Fig. 2.
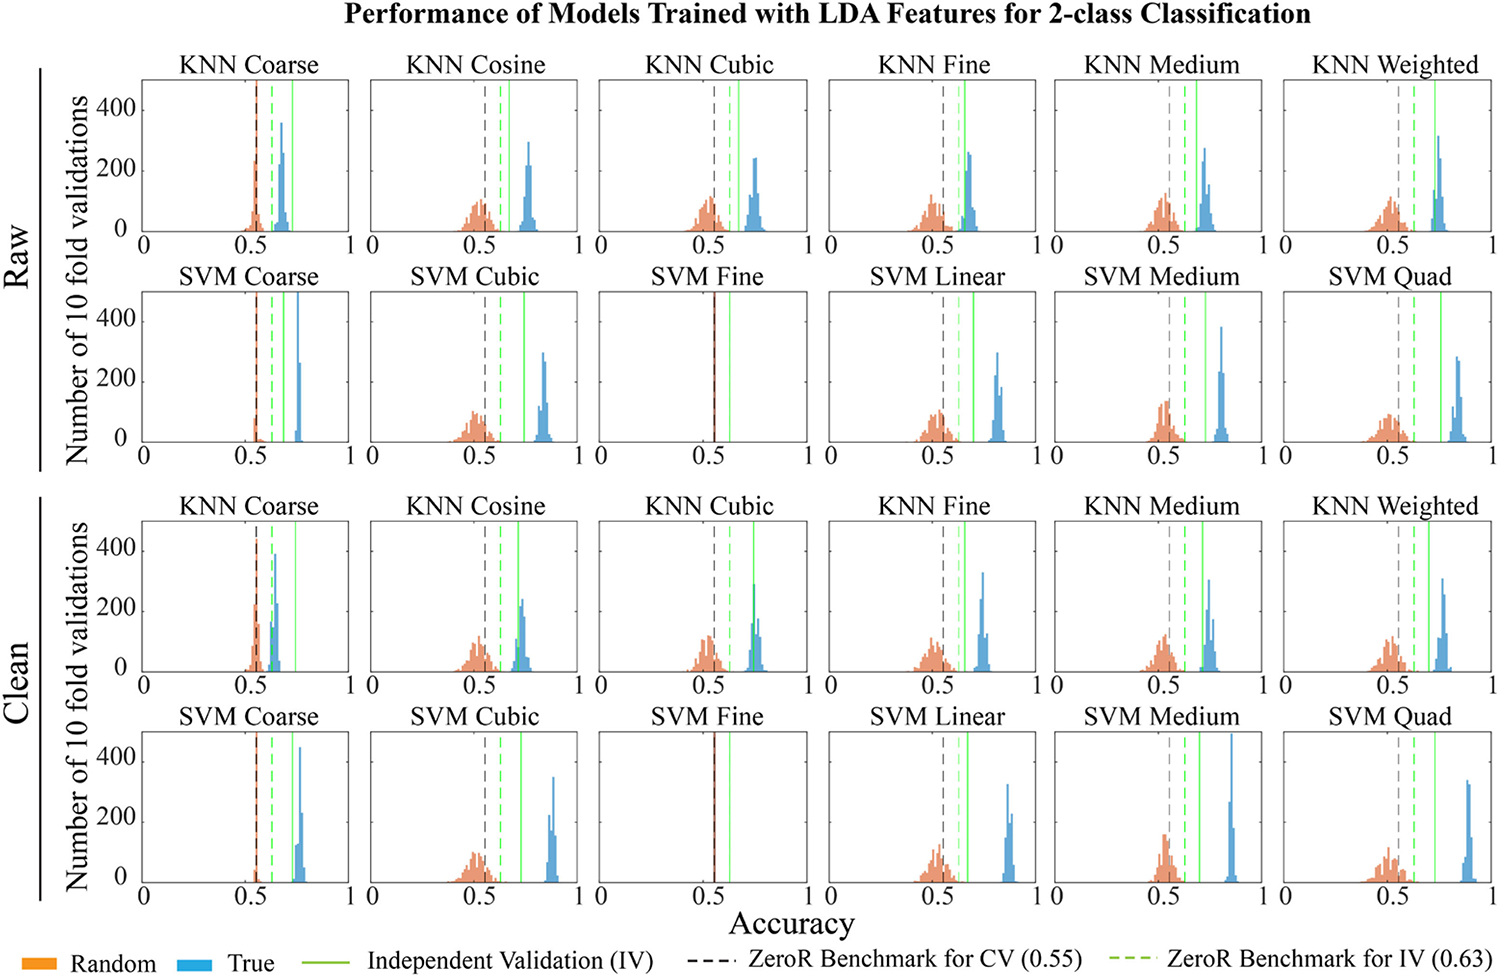
Performance of models trained with features selected by linear discriminant analysis (LDA). The figure shows distribution of accuracies for 1000 iterations of training using randomly labeled data (orange), true labeled data (blue), and independent dataset (green line) for models based on features selected by LDA. Black and green dotted lines show ZeroR benchmarks for cross-validation (CV) and independent validation (IV) respectively. All models trained with true labeled data performed significantly better than randomly labeled data at 10−10 confidence interval in 10-fold CV, except for SVM fine Gaussian models (two sample K-S test). (SVM: support vector machine, KNN: K-nearest neighbors).